
jhuato
Julio Huato
Recently Published
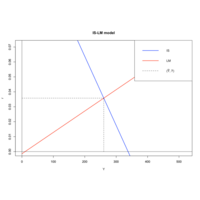
IS-LM Plot
IS-LM Plot
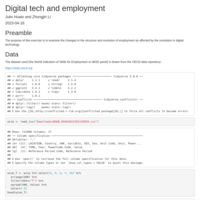
JH ZL digital tech and employment
JH ZL digital tech and employment
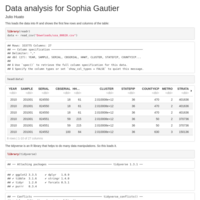
Sophia Gautier: data analysis for her BA thesis
Sophia Gautier: data analysis for her BA thesis
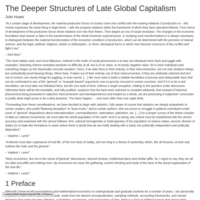
The Deeper Structures of Late Global Capitalism
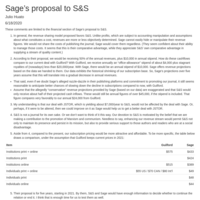
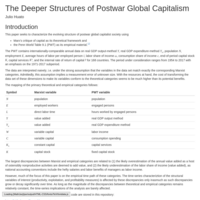
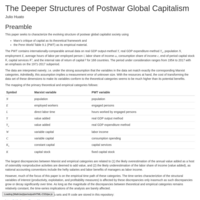
This is the 2/2021 version of the document. It contains the results of the analysis of the PWT 10.0.
All critical commentary will be welcome.
Eora26 project
Eora26 project

Stocks and flows
Stocks and flows

Relations among variables, functions, etc.
Relations among variables, functions, etc.

Math for Economics etc.: Models
Math for Economics etc.: Models
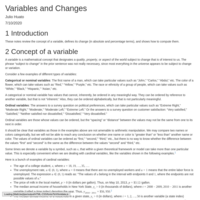
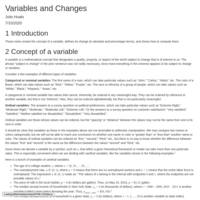
Variables and changes
Variables and changes.

Production and learning
Lecture outline: Production and learning.
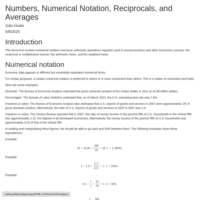
Numbers, etc.
Numerical notation and some arithmetic.

Probability theory review
Probability theory review
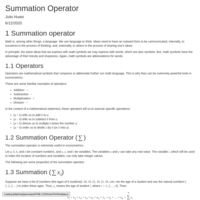
Summation
A brief review of the properties of the summation operator.

Introduction to Probability Theory with R
Introduction to Probability Theory with R

Introduction to probability theory
Introduction to probability theory
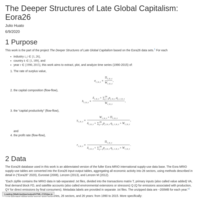
The Deeper Structures of Late Global Capitalism: Eora26
The Deeper Structures of Late Global Capitalism: Eora26
README.Rmd
Math for Economics and R
Math for Economics and R. This section introduces mathematical-economic models. You should study Alpha Chiang, ch. 2.
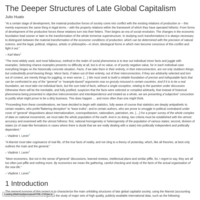
The Deeper Structures of Late Global Capitalist Society
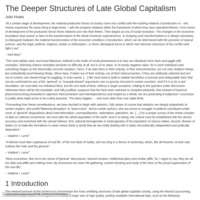
This project, titled "The Deeper Structures of Late Global Capitalist Society" is a work in progress.

R Quiz 1
Your first R project.

Math for Economics & Econometrics with R
Math for Economics & Econometrics with R: An Independent Study
The Deeper Structures of Postwar Global Capitalism
The Deeper Structures of Postwar Global Capitalism: updated, but still crude.
The Deeper Structures of Postwar Global Capitalism
The Deeper Structures of Postwar Global Capitalism
The Deeper Structures of Postwar Global Capitalism
The Deeper Structures of Postwar Global Capitalism
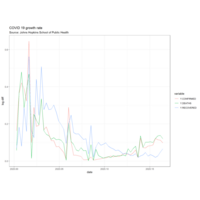
COVID 19 growth rates
COVID 19 growth rates
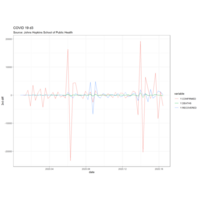
COVID 19 3rd differences
COVID 19 3rd differences
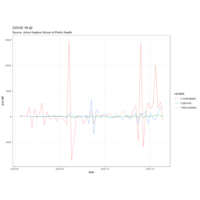
COVID 19 2nd differences
COVID 19 2nd differences

COVID 19 1st differences
COVID 19 1st differences
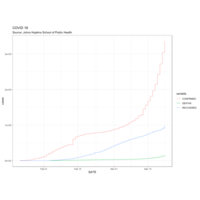
COVID 19 cases
COVID 19 cases
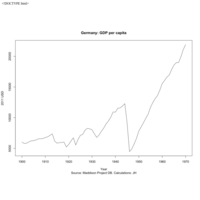
Germany between the wars: GDP per capita
Germany between the wars: GDP per capita.
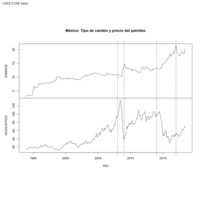
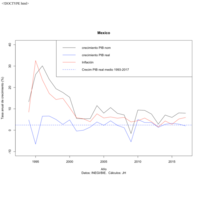
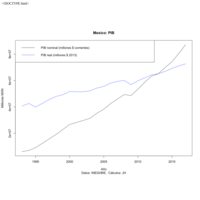
Mexico: PIB nominal y real 1993-2017
Nominal y real.
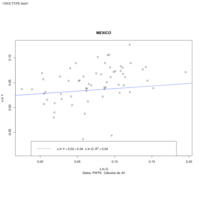
Mexico: log diff G vs. log diff Y
Estimación del efecto que el crecimiento del gasto público anual en México tiene en el crecimiento del PIB anual. Por cada 1% de crecimiento en el gasto público anual, el PIB crece en 0.3%. Según esta estimación (muy burda), si AMLO incrementa el gasto público cada uno de los 6 años de su mandato en 10% en comparación con cada año anterior, entonces el PIB incrementará su tasa de crecimiento en un promedio de 3% anual.
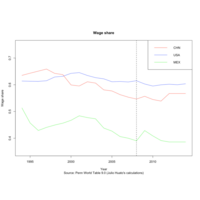
Wage share: China, USA, Mexico
From PWT 9.0. Vertical dashed line at 2008 (onset of global crisis) to highlight the different trends of the wage share post crisis in each country.
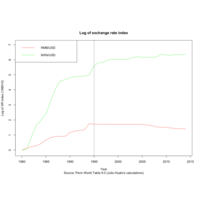
Exchange rate (log of index vs USD): RMB, MXN
From the PWT 9.0. Vertical dashed line at 1995, inflection of China's RMB.
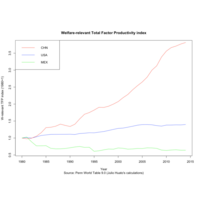
Welfare-relevant TPF: China, USA, Mexico
From the PWT 9.0.
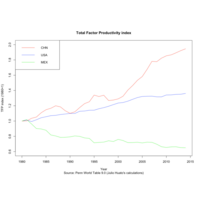
TFP: China, USA, Mexico
From the PWT 9.0.
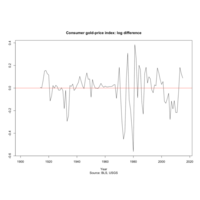
Consumer gold-price index: log difference
Consumer gold-price index: log difference.
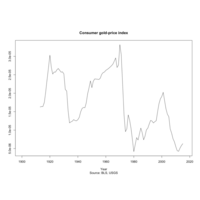
Consumer gold price index
This is an index of consumer prices, but instead of in USD or some other currency, they are in gold units. Obtained by taking a ratio of the US (BLS) CPI index to the (USGS) annual average unit price of gold (1 metric ton) in current USD.
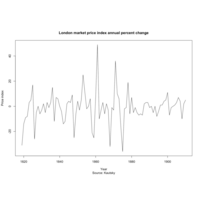
Kautsky "High Cost of Living": Annual percent change of London markets price index
Kautsky "High Cost of Living": Annual percent change of London markets price index
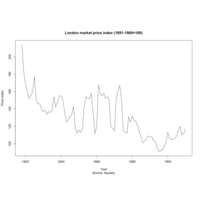
Kautsky "High Cost of Living": London markets price index
Kautsky "High Cost of Living": London markets price index (1891-1900=100)
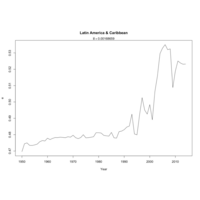
Latin America & Caribbean rate of exploitation
The neoliberal counterrevolution from the 1980s is most outstanding, and the shift to the level led by Chavez's Venezuela in the 2000s.

Rate of profit (by region)
The profit rates converged (downwards) in the 1990s and early 2000s. The following recovery of the global profit rate is owed to (1) Middle East & North Africa, (2) Sub-Saharan Africa, and (3) South Asia. To a lesser extent it is due to Latin America & Caribbean and Central Asia (bundled together here with Europe). The profit rate in Europe and North America, while also increasing, has been a drag for the global profit rate.
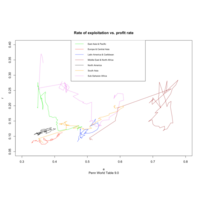
Rate of exploitation vs. profit rate
In South Asia and in the Middle East & North Africa (oil wealth!) regions is where exploitation has been most apparent in the sense that the profit rate has moved most in tandem with the rate of exploitation; and similarly but with less variation in North America and Europe & Central Asia. Where exploitation has been least apparent is in the East Asia & Pacific region. (Marx said that the profit rate was the rate of exploitation in disguise; the disguise being supplied by the notion that capital is productive, i.e. rho.)
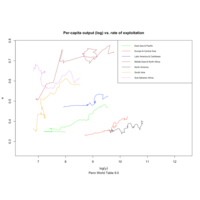
Output per capita vs. rate of exploitation (regions) PWT9
Only in Sub-Saharan Africa, and only as a temporary consequence of the anti-colonial revolutions, did increases in productivity translate into reductions in the rate of exploitation. In the overwhelming majority of historical cases, increases in productivity led almost directly to higher rates of exploitation. #relativesurplusvalue
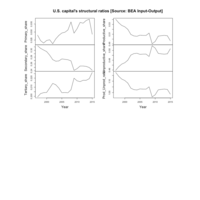
US capital's structural ratios (1997-2015) (2)
Source: BEA Input Output
Total Commodity Output is gross of Intermediate
Primary_share = (Agriculture, forestry, fishing, and hunting+Mining)/Total Commodity Output
Secondary_share=(Utilities+Construction+Manufacturing)/Total Commodity Output
Tertiary_share=(Transportation and warehousing+Information+Educational services, health care, and social assistance+Arts, entertainment, recreation, accommodation, and food services+Other services, except government)/Total Commodity Output
Productive_share=Primary_share+Secondary_share+Tertiary_share
Unproductive_share=(Wholesale trade+Retail trade+Finance, insurance, real estate, rental, and leasing+Professional and business services+Government)/Total Commodity Output
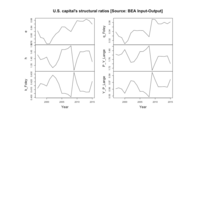
US capital's structural ratios (1997-2015)
Source: BEA Input-Output data
s \equiv Taxes on production and imports, less subsidies + Gross operating surplus
v \equiv Compensation of employees
c \equiv Total intermediate
e \equiv \frac{s}{v}
h \equiv \frac{c}{v}
k \equiv \frac{v}{c+v}
q = e k
\frac{P}{Y} \equiv \frac{c+v+s}{v+s}
\frac{Y}{P} \equiv \frac{v+s}{c+v+s}
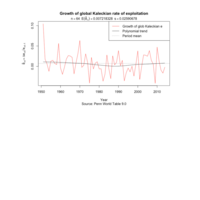
Growth of global Kaleckian rate of exploitation
Much less volatility than private, but otherwise similar patterns.
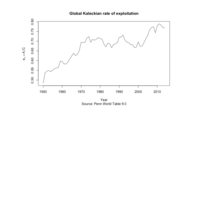
Global Kaleckian rate of exploitation
Similar characteristics as the private one, though higher average (naturally) and less volatile (again, since public investment spending smooths the roughness of the private one). Otherwise, similar. (See my comments on the private Kaleckian e plots.)

Growth of global private Kaleckian rate of exploitation
Basically, same average growth rate than regular e, though more volatile. The big difference: this rate of exploitation decelerates in the 1950s, 1960s, and 1970s while regular e goes up and only declines from the 1970s on. Like regular e, the growth rate of private Kaleckian e bottoms in the 1980s and then goes up until the crisis. My conjecture about the discrepant paths: Assuming C reflects workers' consumption (big if, as perhaps capitalist consumption share declined in that sub period), before the 1970s, the workers were losing de facto ground in terms of C. In the 2000s, they recovered that ground via credit. But that didn't last. One point I make more clearly in the paper: It is not the same to have your standard of living formalized in the legal form of wages and enforce that legal fiction than to be subject to the vagaries of consumption financing. The latter is risky living, which goes with being the proletariat. With political response, workers can use their de facto leverage though.
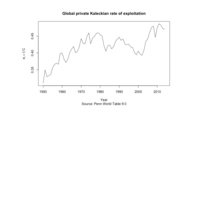
Global private Kaleckian rate of exploitation
Here I invoke Kalecki's dictum: "Workers consume what they earn. Capitalists earn what they invest." Thus, e_iota = I/K. The interesting thing here is the path discrepancy with the regular rate of exploitation, calculated on the basis of the PWT wage share estimates. More on this in my paper.
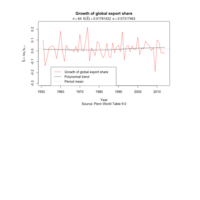
Growth of global export share
Accelerating trend, overall. (See my comment on the level plot.)
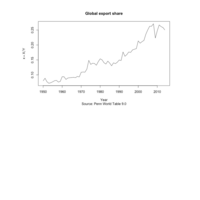
Global export share
This is a proxy for the extent of globalization. This is consistent with the impression that globalization had a slow but steady pace, with stagnation from the mid 1970s to early 1980s, followed by an aggressive expansion in the 1990s and 2000s. Finally, the downturn with the crisis.
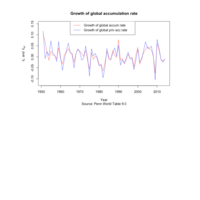
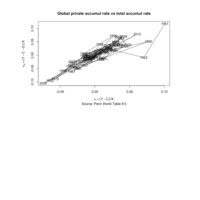
Growth of global accumulation & private accumulation rates
This is not surprising: The public component of gross capital formation ("gross" is because it is inclusive of depreciation) acts as a buffer a la Keynesian "automatic stabilizer."
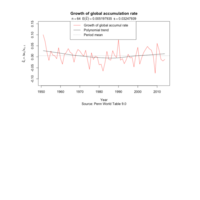
Growth of global accumulation rate
Basically, the same story as in the profit rate and the private accumulation rate.
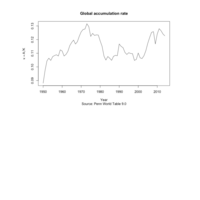
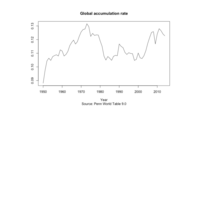
Global accumulation rate
"Accumulation" (or, more precisely, the "accumulation fund") is defined as A = I + gov gross capital formation. Since at the global level, exports and imports cancel out, then A = Y - C a fortiori, where C is private consumption spending. That is how A gets pinned down. The accumulation rate kappa = A/K is a proxy for the profit rate as well. (See my comment on global private accumulation rate.)
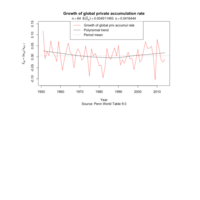
Growth of global private accumulation rate
See my comment on global private accumulation rate. This is the growth rate. Positive growth rates in the 1950s and 1960s turn into negative ones in the 1970s, which persist up to the mid 1980s. The negative growth rates return in the early 1990s, and then the brief inflection of the 2000s followed by the crisis.
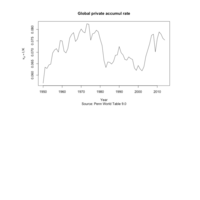
Global private accumulation rate
My "private accumulation" category corresponds to "private gross capital formation" or "private investment spending" in the PWT 9. The PWT 9 gives us the share of private investment spending in real GDP (output approach). That multiplied by real GDP gives us private investment spending. The government share is only consumption, it does not include capital formation by the government. That is what I call "accumulation" (without the "private" modifier).
In a Kaleckian framework, profits = investment. In this sense, kappa_p = I/K is a proxy for the profit rate. (The subscript is for "private.") In my paper I discuss this point extensively.
We see an increase in kappa_p in the earlier period that peaks in the earlier 1970s, then decline (associated with a sudden drop in capital "productivity"). In the mid 1980s, there is partial restoration of kappa_p that exhausts itself in the early 1990s, then decline. Finally, restoration in earnest in the 2000s, and then the crisis.
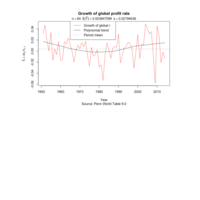
Growth of global profit rate
Deceleration of the profit rate up to the late 1970s, and then gentle recovery/stagnation with increased volatility associated with the crisis.
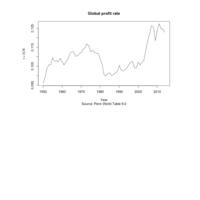
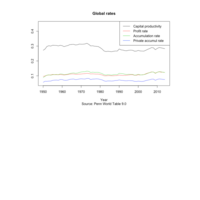
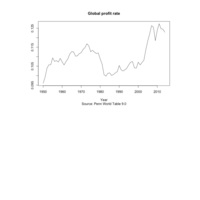
Global profit rate
The early increase (if data for the period are reliable) is largely due to the increase in "capital productivity" and to a lesser extent to the gradual increase in the rate of exploitation. The decline of 1.5% in the mid 1970s to early 1980s is associated mainly with the drop in capital "productivity." The subsequent recovery in the profit rate is almost entirely due to the vicious increase in the rate of exploitation.
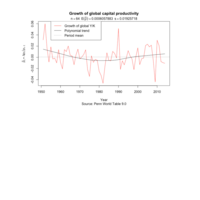
Growth of global capital "productivity"
Again, sudden decay in the 1970s to early 1980s and relative stagnation since.

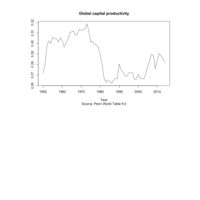
Global capital "productivity"
The most remarkable phenomenon here is the sudden decline in the output/capital ratio in the 1970s to early 1980s, and its relative stagnation thereafter. More on this later.
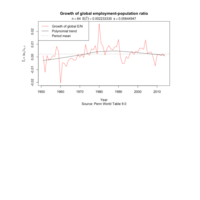
Growth of the global employment-population ratio
Acceleration up to the mid 1980s, and then gentle deceleration.
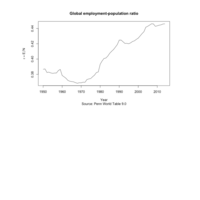
Global employment-population ratio
This is a "synthesis" of many determinations. Some conjectures: the demographic transition (slow down in population growth), incorporation of women into the labor force, the bumps caused by incorporation of large countries to the PWT (e.g. Russian Fed, etc.) starting at the 1990s. Other things equal, an increase in the E/N ratio entails an improvement in the class balance of forces in favor of workers, and vice versa, but other things are not equal.
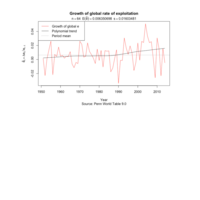
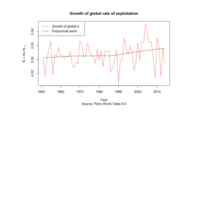
Growth of the global rate of exploitation
The polynomial trend shows a steady increase in the rate of exploitation during the 1950s and 1960s, its relative decline/stagnation in the 1970s and 1980s, its aggressive acceleration in the late 1990s and 2000s, and its struggles after the crisis.

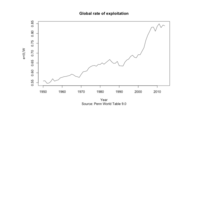
Global rate of exploitation
Note its acceleration in the late 1990s and 2000s, and its stagnation after the crisis.
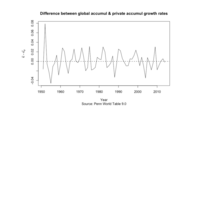
Difference between global private and total accumulation rates
1952 is an outlier, but otherwise it looks stationary.
Global rate of exploitation (level) [Note its acceleration in the 2000s]
These plots show time series of the return rates on over 100 leading international stock indices. This is part of a larger project on the deep history of postwar global capitalism that seeks to analyze international economic data to characterize the evolving structure of postwar global capitalist society.
Growth of the global rate of exploitation
These plots show time series of the return rates on over 100 leading international stock indices. This is part of a larger project on the deep history of postwar global capitalism that seeks to analyze international economic data to characterize the evolving structure of postwar global capitalist society.
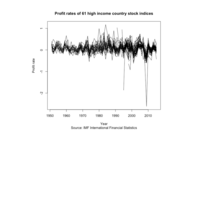
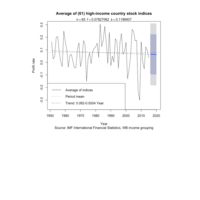
Profit rates of 61 high income country stock indices
These plots show time series of the return rates on over 100 leading international stock indices. This is part of a larger project on the deep history of postwar global capitalism that seeks to analyze international economic data to characterize the evolving structure of postwar global capitalist society.
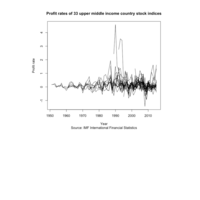
Profit rates of 33 upper middle income country stock indices
These plots show time series of the return rates on over 100 leading international stock indices. This is part of a larger project on the deep history of postwar global capitalism that seeks to analyze international economic data to characterize the evolving structure of postwar global capitalist society.
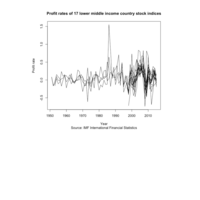
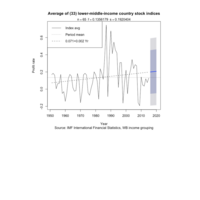
Profit rates of 17 lower-middle income country stock indices
These plots show time series of the return rates on over 100 leading international stock indices. This is part of a larger project on the deep history of postwar global capitalism that seeks to analyze international economic data to characterize the evolving structure of postwar global capitalist society.
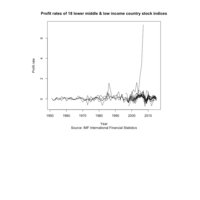
Profit rates of 18 lower-middle & low income country stock indices
These plots show time series of the return rates on over 100 leading international stock indices. This is part of a larger project on the deep history of postwar global capitalism that seeks to analyze international economic data to characterize the evolving structure of postwar global capitalist society.
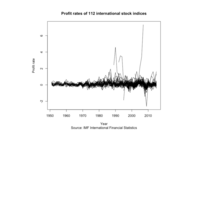
Profit rates of 112 international stock indices
These plots show time series of the return rates on over 100 leading international stock indices. This is part of a larger project on the deep history of postwar global capitalism that seeks to analyze international economic data to characterize the evolving structure of postwar global capitalist society.
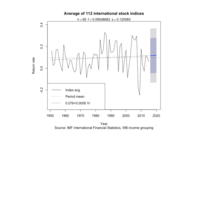
Average of 112 international stock indices (profit rate)
These plots show time series of the return rates on over 100 leading international stock indices. This is part of a larger project on the deep history of postwar global capitalism that seeks to analyze international economic data to characterize the evolving structure of postwar global capitalist society.
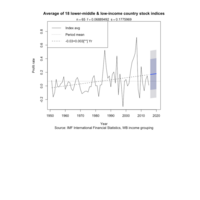
Average of 18 lower-middle & low income country stock indices (profit rate)
These plots show time series of the return rates on over 100 leading international stock indices. This is part of a larger project on the deep history of postwar global capitalism that seeks to analyze international economic data to characterize the evolving structure of postwar global capitalist society.
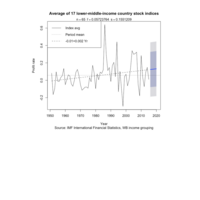
Average of 17 lower-middle income country stock indices (profit rate)
These plots show time series of the return rates on over 100 leading international stock indices. This is part of a larger project on the deep history of postwar global capitalism that seeks to analyze international economic data to characterize the evolving structure of postwar global capitalist society.
Average of 33 upper-middle-income country stock indices (profit rate)
These plots show time series of the return rates on over 100 leading international stock indices. This is part of a larger project on the deep history of postwar global capitalism that seeks to analyze international economic data to characterize the evolving structure of postwar global capitalist society.

Wilshire 5000 Total Market Index end of period (profit rate)
These plots show time series of the return rates on over 100 leading international stock indices. This is part of a larger project on the deep history of postwar global capitalism that seeks to analyze international economic data to characterize the evolving structure of postwar global capitalist society.
Average of 61 high-income country stock indices (profit rate)
These plots show time series of the return rates on over 100 leading international stock indices. This is part of a larger project on the deep history of postwar global capitalism that seeks to analyze international economic data to characterize the evolving structure of postwar global capitalist society.
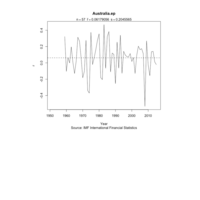
Australia end of period
These plots show time series of the return rates on over 100 leading international stock indices. This is part of a larger project on the deep history of postwar global capitalism that seeks to analyze international economic data to characterize the evolving structure of postwar global capitalist society.
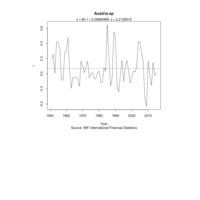
Austria end of period
These plots show time series of the return rates on over 100 leading international stock indices. This is part of a larger project on the deep history of postwar global capitalism that seeks to analyze international economic data to characterize the evolving structure of postwar global capitalist society.
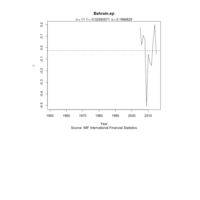
Bahrain end of period
These plots show time series of the return rates on over 100 leading international stock indices. This is part of a larger project on the deep history of postwar global capitalism that seeks to analyze international economic data to characterize the evolving structure of postwar global capitalist society.
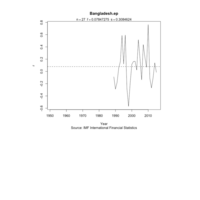
Bangladesh end of period
These plots show time series of the return rates on over 100 leading international stock indices. This is part of a larger project on the deep history of postwar global capitalism that seeks to analyze international economic data to characterize the evolving structure of postwar global capitalist society.
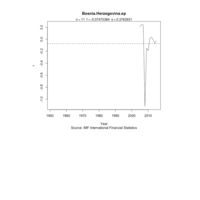
Bosnia and Herzegovina end of period
These plots show time series of the return rates on over 100 leading international stock indices. This is part of a larger project on the deep history of postwar global capitalism that seeks to analyze international economic data to characterize the evolving structure of postwar global capitalist society.
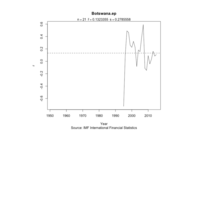
Botswana end of period
These plots show time series of the return rates on over 100 leading international stock indices. This is part of a larger project on the deep history of postwar global capitalism that seeks to analyze international economic data to characterize the evolving structure of postwar global capitalist society.
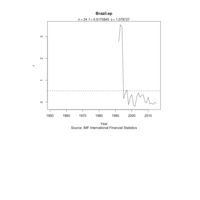
Brazil end of period
These plots show time series of the return rates on over 100 leading international stock indices. This is part of a larger project on the deep history of postwar global capitalism that seeks to analyze international economic data to characterize the evolving structure of postwar global capitalist society.

Bulgaria end of period
These plots show time series of the return rates on over 100 leading international stock indices. This is part of a larger project on the deep history of postwar global capitalism that seeks to analyze international economic data to characterize the evolving structure of postwar global capitalist society.
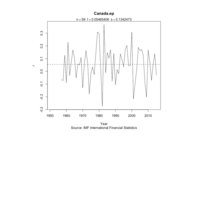
Canada end of period
These plots show time series of the return rates on over 100 leading international stock indices. This is part of a larger project on the deep history of postwar global capitalism that seeks to analyze international economic data to characterize the evolving structure of postwar global capitalist society.
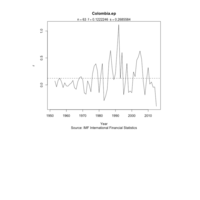
Colombia end of period
These plots show time series of the return rates on over 100 leading international stock indices. This is part of a larger project on the deep history of postwar global capitalism that seeks to analyze international economic data to characterize the evolving structure of postwar global capitalist society.
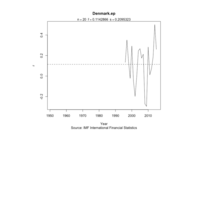
Denmark end of period
These plots show time series of the return rates on over 100 leading international stock indices. This is part of a larger project on the deep history of postwar global capitalism that seeks to analyze international economic data to characterize the evolving structure of postwar global capitalist society.
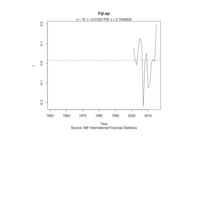
Fiji end of period
These plots show time series of the return rates on over 100 leading international stock indices. This is part of a larger project on the deep history of postwar global capitalism that seeks to analyze international economic data to characterize the evolving structure of postwar global capitalist society.
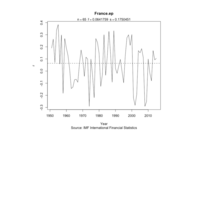
France end of period
These plots show time series of the return rates on over 100 leading international stock indices. This is part of a larger project on the deep history of postwar global capitalism that seeks to analyze international economic data to characterize the evolving structure of postwar global capitalist society.

Germany end of period
These plots show time series of the return rates on over 100 leading international stock indices. This is part of a larger project on the deep history of postwar global capitalism that seeks to analyze international economic data to characterize the evolving structure of postwar global capitalist society.
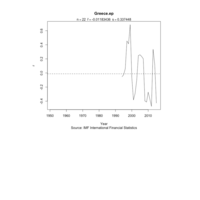
Greece end of period
These plots show time series of the return rates on over 100 leading international stock indices. This is part of a larger project on the deep history of postwar global capitalism that seeks to analyze international economic data to characterize the evolving structure of postwar global capitalist society.
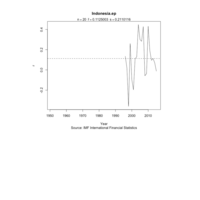
Indonesia end of period
These plots show time series of the return rates on over 100 leading international stock indices. This is part of a larger project on the deep history of postwar global capitalism that seeks to analyze international economic data to characterize the evolving structure of postwar global capitalist society.
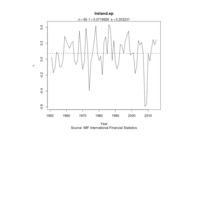
Ireland end of period
These plots show time series of the return rates on over 100 leading international stock indices. This is part of a larger project on the deep history of postwar global capitalism that seeks to analyze international economic data to characterize the evolving structure of postwar global capitalist society.
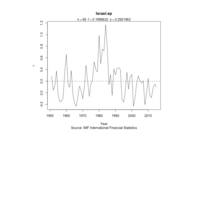
Israel end of period
These plots show time series of the return rates on over 100 leading international stock indices. This is part of a larger project on the deep history of postwar global capitalism that seeks to analyze international economic data to characterize the evolving structure of postwar global capitalist society.
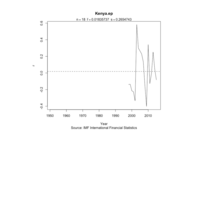
Kenya end of period
These plots show time series of the return rates on over 100 leading international stock indices. This is part of a larger project on the deep history of postwar global capitalism that seeks to analyze international economic data to characterize the evolving structure of postwar global capitalist society.
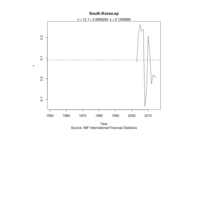
South Korea end of period
These plots show time series of the return rates on over 100 leading international stock indices. This is part of a larger project on the deep history of postwar global capitalism that seeks to analyze international economic data to characterize the evolving structure of postwar global capitalist society.

Kuwait end of period
These plots show time series of the return rates on over 100 leading international stock indices. This is part of a larger project on the deep history of postwar global capitalism that seeks to analyze international economic data to characterize the evolving structure of postwar global capitalist society.
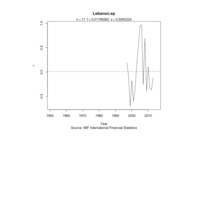
Lebanon end of period
These plots show time series of the return rates on over 100 leading international stock indices. This is part of a larger project on the deep history of postwar global capitalism that seeks to analyze international economic data to characterize the evolving structure of postwar global capitalist society.
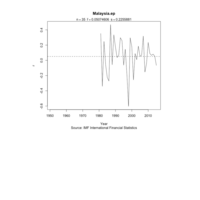
Malaysia end of period
These plots show time series of the return rates on over 100 leading international stock indices. This is part of a larger project on the deep history of postwar global capitalism that seeks to analyze international economic data to characterize the evolving structure of postwar global capitalist society.
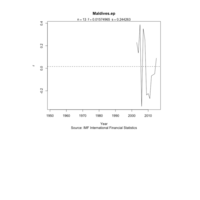
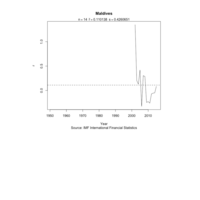
Maldives end of period
These plots show time series of the return rates on over 100 leading international stock indices. This is part of a larger project on the deep history of postwar global capitalism that seeks to analyze international economic data to characterize the evolving structure of postwar global capitalist society.
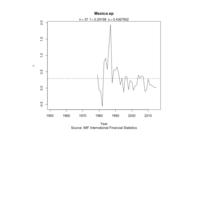
Mexico end of period
These plots show time series of the return rates on over 100 leading international stock indices. This is part of a larger project on the deep history of postwar global capitalism that seeks to analyze international economic data to characterize the evolving structure of postwar global capitalist society.
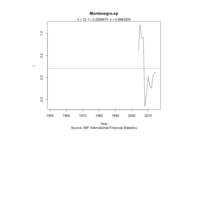
Montenegro end of period
These plots show time series of the return rates on over 100 leading international stock indices. This is part of a larger project on the deep history of postwar global capitalism that seeks to analyze international economic data to characterize the evolving structure of postwar global capitalist society.
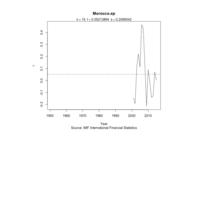
Morocco end of period
These plots show time series of the return rates on over 100 leading international stock indices. This is part of a larger project on the deep history of postwar global capitalism that seeks to analyze international economic data to characterize the evolving structure of postwar global capitalist society.
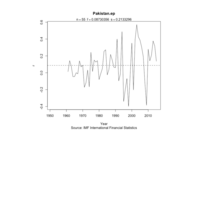
Pakistan end of period
These plots show time series of the return rates on over 100 leading international stock indices. This is part of a larger project on the deep history of postwar global capitalism that seeks to analyze international economic data to characterize the evolving structure of postwar global capitalist society.
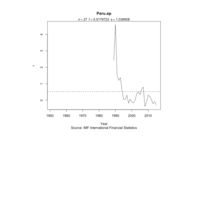
Peru end of period
These plots show time series of the return rates on over 100 leading international stock indices. This is part of a larger project on the deep history of postwar global capitalism that seeks to analyze international economic data to characterize the evolving structure of postwar global capitalist society.
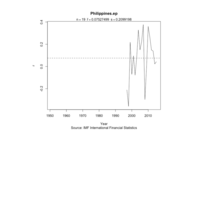
Philippines end of period
These plots show time series of the return rates on over 100 leading international stock indices. This is part of a larger project on the deep history of postwar global capitalism that seeks to analyze international economic data to characterize the evolving structure of postwar global capitalist society.
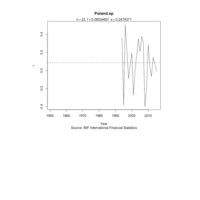
Poland end of period
These plots show time series of the return rates on over 100 leading international stock indices. This is part of a larger project on the deep history of postwar global capitalism that seeks to analyze international economic data to characterize the evolving structure of postwar global capitalist society.
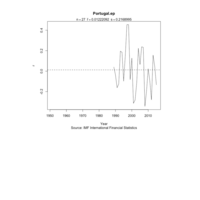
Portugal end of period
These plots show time series of the return rates on over 100 leading international stock indices. This is part of a larger project on the deep history of postwar global capitalism that seeks to analyze international economic data to characterize the evolving structure of postwar global capitalist society.
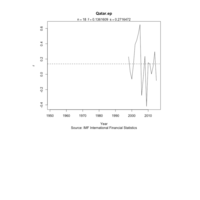
Qatar end of period
These plots show time series of the return rates on over 100 leading international stock indices. This is part of a larger project on the deep history of postwar global capitalism that seeks to analyze international economic data to characterize the evolving structure of postwar global capitalist society.
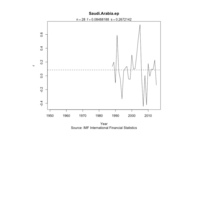
Saudi Arabia end of period
These plots show time series of the return rates on over 100 leading international stock indices. This is part of a larger project on the deep history of postwar global capitalism that seeks to analyze international economic data to characterize the evolving structure of postwar global capitalist society.
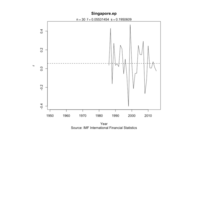
Singapore end of period
These plots show time series of the return rates on over 100 leading international stock indices. This is part of a larger project on the deep history of postwar global capitalism that seeks to analyze international economic data to characterize the evolving structure of postwar global capitalist society.
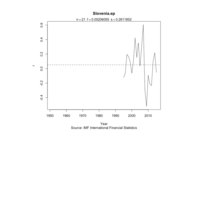
Slovenia end of period
These plots show time series of the return rates on over 100 leading international stock indices. This is part of a larger project on the deep history of postwar global capitalism that seeks to analyze international economic data to characterize the evolving structure of postwar global capitalist society.
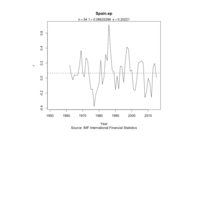
Spain end of period
These plots show time series of the return rates on over 100 leading international stock indices. This is part of a larger project on the deep history of postwar global capitalism that seeks to analyze international economic data to characterize the evolving structure of postwar global capitalist society.
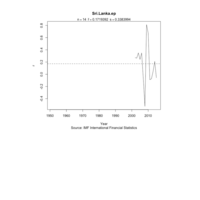
Sri Lanka end of period
These plots show time series of the return rates on over 100 leading international stock indices. This is part of a larger project on the deep history of postwar global capitalism that seeks to analyze international economic data to characterize the evolving structure of postwar global capitalist society.
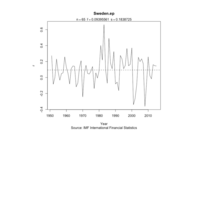
Sweden end of period
These plots show time series of the return rates on over 100 leading international stock indices. This is part of a larger project on the deep history of postwar global capitalism that seeks to analyze international economic data to characterize the evolving structure of postwar global capitalist society.
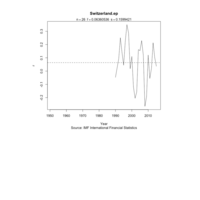
Switzerland end of period
These plots show time series of the return rates on over 100 leading international stock indices. This is part of a larger project on the deep history of postwar global capitalism that seeks to analyze international economic data to characterize the evolving structure of postwar global capitalist society.
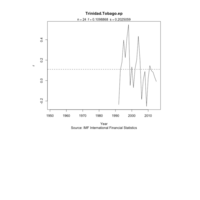
Trinidad and Tobago end of period
These plots show time series of the return rates on over 100 leading international stock indices. This is part of a larger project on the deep history of postwar global capitalism that seeks to analyze international economic data to characterize the evolving structure of postwar global capitalist society.
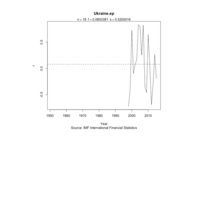
Ukraine end of period
These plots show time series of the return rates on over 100 leading international stock indices. This is part of a larger project on the deep history of postwar global capitalism that seeks to analyze international economic data to characterize the evolving structure of postwar global capitalist society.
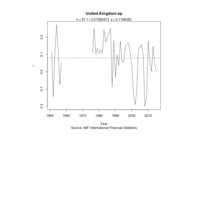
United Kingdom end of period
These plots show time series of the return rates on over 100 leading international stock indices. This is part of a larger project on the deep history of postwar global capitalism that seeks to analyze international economic data to characterize the evolving structure of postwar global capitalist society.
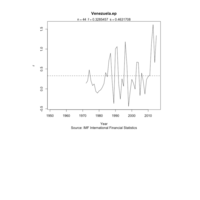
Venezuela end of period
These plots show time series of the return rates on over 100 leading international stock indices. This is part of a larger project on the deep history of postwar global capitalism that seeks to analyze international economic data to characterize the evolving structure of postwar global capitalist society.
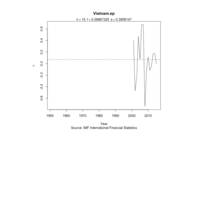
Vietnam end of period
These plots show time series of the return rates on over 100 leading international stock indices. This is part of a larger project on the deep history of postwar global capitalism that seeks to analyze international economic data to characterize the evolving structure of postwar global capitalist society.
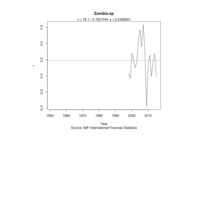
Zambia end of period
These plots show time series of the return rates on over 100 leading international stock indices. This is part of a larger project on the deep history of postwar global capitalism that seeks to analyze international economic data to characterize the evolving structure of postwar global capitalist society.
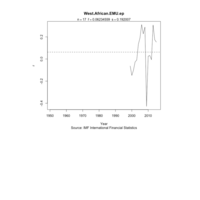
West African EMU end of period
These plots show time series of the return rates on over 100 leading international stock indices. This is part of a larger project on the deep history of postwar global capitalism that seeks to analyze international economic data to characterize the evolving structure of postwar global capitalist society.
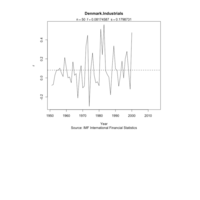
Denmark Industrials
These plots show time series of the return rates on over 100 leading international stock indices. This is part of a larger project on the deep history of postwar global capitalism that seeks to analyze international economic data to characterize the evolving structure of postwar global capitalist society.
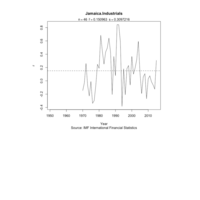
Jamaica Industrials
These plots show time series of the return rates on over 100 leading international stock indices. This is part of a larger project on the deep history of postwar global capitalism that seeks to analyze international economic data to characterize the evolving structure of postwar global capitalist society.
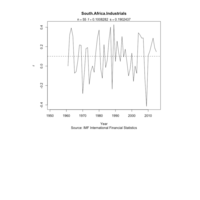
South Africa Industrials
These plots show time series of the return rates on over 100 leading international stock indices. This is part of a larger project on the deep history of postwar global capitalism that seeks to analyze international economic data to characterize the evolving structure of postwar global capitalist society.
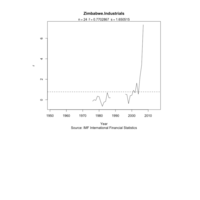
Zimbabwe Industrials
These plots show time series of the return rates on over 100 leading international stock indices. This is part of a larger project on the deep history of postwar global capitalism that seeks to analyze international economic data to characterize the evolving structure of postwar global capitalist society.
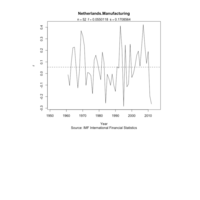
Netherlands Manufacturing
These plots show time series of the return rates on over 100 leading international stock indices. This is part of a larger project on the deep history of postwar global capitalism that seeks to analyze international economic data to characterize the evolving structure of postwar global capitalist society.
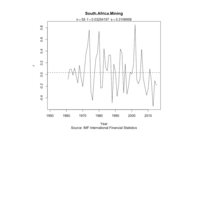
South Africa Mining
These plots show time series of the return rates on over 100 leading international stock indices. This is part of a larger project on the deep history of postwar global capitalism that seeks to analyze international economic data to characterize the evolving structure of postwar global capitalist society.
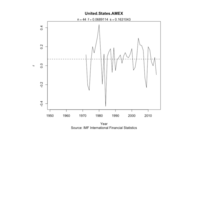
United States AMEX
These plots show time series of the return rates on over 100 leading international stock indices. This is part of a larger project on the deep history of postwar global capitalism that seeks to analyze international economic data to characterize the evolving structure of postwar global capitalist society.
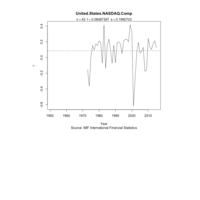
United States NASDAQ Composite
These plots show time series of the return rates on over 100 leading international stock indices. This is part of a larger project on the deep history of postwar global capitalism that seeks to analyze international economic data to characterize the evolving structure of postwar global capitalist society.
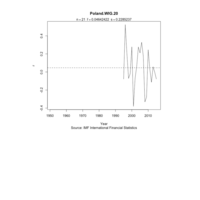
Poland WIG 20
These plots show time series of the return rates on over 100 leading international stock indices. This is part of a larger project on the deep history of postwar global capitalism that seeks to analyze international economic data to characterize the evolving structure of postwar global capitalist society.
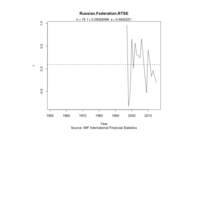
Russian Federation RTSE
These plots show time series of the return rates on over 100 leading international stock indices. This is part of a larger project on the deep history of postwar global capitalism that seeks to analyze international economic data to characterize the evolving structure of postwar global capitalist society.
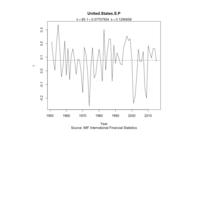
United States S&P
These plots show time series of the return rates on over 100 leading international stock indices. This is part of a larger project on the deep history of postwar global capitalism that seeks to analyze international economic data to characterize the evolving structure of postwar global capitalist society.
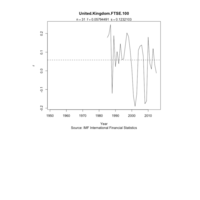
United Kingdom FTSE 100
These plots show time series of the return rates on over 100 leading international stock indices. This is part of a larger project on the deep history of postwar global capitalism that seeks to analyze international economic data to characterize the evolving structure of postwar global capitalist society.
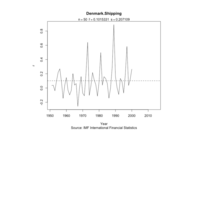
Denmark Shipping
These plots show time series of the return rates on over 100 leading international stock indices. This is part of a larger project on the deep history of postwar global capitalism that seeks to analyze international economic data to characterize the evolving structure of postwar global capitalist society.
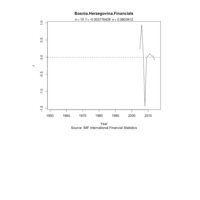
Bosnia and Herzegovina Financials
These plots show time series of the return rates on over 100 leading international stock indices. This is part of a larger project on the deep history of postwar global capitalism that seeks to analyze international economic data to characterize the evolving structure of postwar global capitalist society.
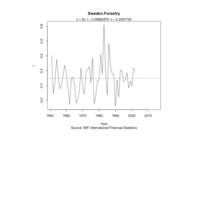
Sweden Forestry
These plots show time series of the return rates on over 100 leading international stock indices. This is part of a larger project on the deep history of postwar global capitalism that seeks to analyze international economic data to characterize the evolving structure of postwar global capitalist society.
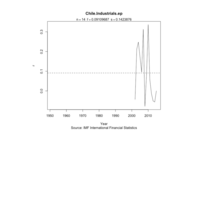
Chile Industrials end of period
These plots show time series of the return rates on over 100 leading international stock indices. This is part of a larger project on the deep history of postwar global capitalism that seeks to analyze international economic data to characterize the evolving structure of postwar global capitalist society.
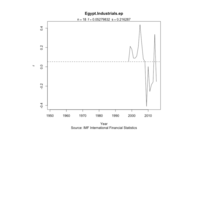
Egypt Industrials end of period
These plots show time series of the return rates on over 100 leading international stock indices. This is part of a larger project on the deep history of postwar global capitalism that seeks to analyze international economic data to characterize the evolving structure of postwar global capitalist society.
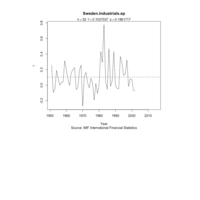
Sweden Industrials end of period
These plots show time series of the return rates on over 100 leading international stock indices. This is part of a larger project on the deep history of postwar global capitalism that seeks to analyze international economic data to characterize the evolving structure of postwar global capitalist society.
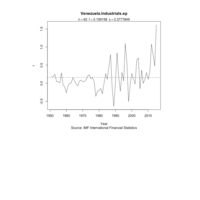
Venezuela Industrials end of period
These plots show time series of the return rates on over 100 leading international stock indices. This is part of a larger project on the deep history of postwar global capitalism that seeks to analyze international economic data to characterize the evolving structure of postwar global capitalist society.
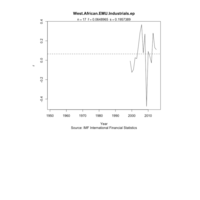
West African EMU Industrials end of period
These plots show time series of the return rates on over 100 leading international stock indices. This is part of a larger project on the deep history of postwar global capitalism that seeks to analyze international economic data to characterize the evolving structure of postwar global capitalist society.
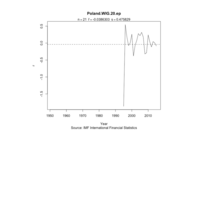
Poland WIG 20 end of period
These plots show time series of the return rates on over 100 leading international stock indices. This is part of a larger project on the deep history of postwar global capitalism that seeks to analyze international economic data to characterize the evolving structure of postwar global capitalist society.
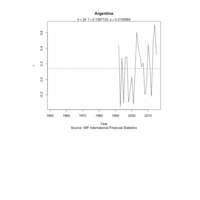
Argentina
These plots show time series of the return rates on over 100 leading international stock indices. This is part of a larger project on the deep history of postwar global capitalism that seeks to analyze international economic data to characterize the evolving structure of postwar global capitalist society.
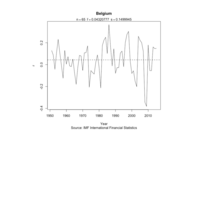
Belgium
These plots show time series of the return rates on over 100 leading international stock indices. This is part of a larger project on the deep history of postwar global capitalism that seeks to analyze international economic data to characterize the evolving structure of postwar global capitalist society.
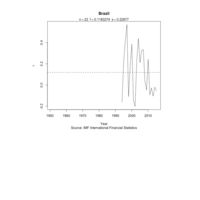
Brazil
These plots show time series of the return rates on over 100 leading international stock indices. This is part of a larger project on the deep history of postwar global capitalism that seeks to analyze international economic data to characterize the evolving structure of postwar global capitalist society.
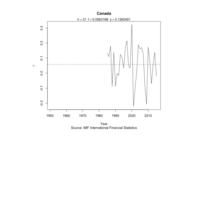
Canada
These plots show time series of the return rates on over 100 leading international stock indices. This is part of a larger project on the deep history of postwar global capitalism that seeks to analyze international economic data to characterize the evolving structure of postwar global capitalist society.
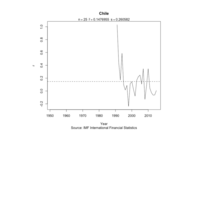
Chile
These plots show time series of the return rates on over 100 leading international stock indices. This is part of a larger project on the deep history of postwar global capitalism that seeks to analyze international economic data to characterize the evolving structure of postwar global capitalist society.

Hong Kong
These plots show time series of the return rates on over 100 leading international stock indices. This is part of a larger project on the deep history of postwar global capitalism that seeks to analyze international economic data to characterize the evolving structure of postwar global capitalist society.
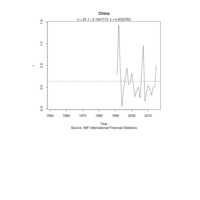
China
These plots show time series of the return rates on over 100 leading international stock indices. This is part of a larger project on the deep history of postwar global capitalism that seeks to analyze international economic data to characterize the evolving structure of postwar global capitalist society.
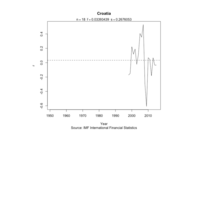
Croatia
These plots show time series of the return rates on over 100 leading international stock indices. This is part of a larger project on the deep history of postwar global capitalism that seeks to analyze international economic data to characterize the evolving structure of postwar global capitalist society.
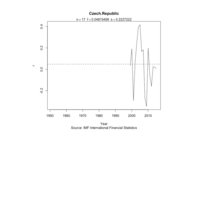
Czech Republic
These plots show time series of the return rates on over 100 leading international stock indices. This is part of a larger project on the deep history of postwar global capitalism that seeks to analyze international economic data to characterize the evolving structure of postwar global capitalist society.
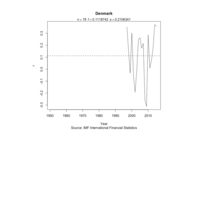
Denmark
These plots show time series of the return rates on over 100 leading international stock indices. This is part of a larger project on the deep history of postwar global capitalism that seeks to analyze international economic data to characterize the evolving structure of postwar global capitalist society.
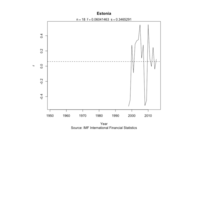
Estonia
These plots show time series of the return rates on over 100 leading international stock indices. This is part of a larger project on the deep history of postwar global capitalism that seeks to analyze international economic data to characterize the evolving structure of postwar global capitalist society.
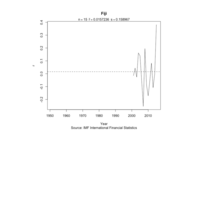
Fiji
These plots show time series of the return rates on over 100 leading international stock indices. This is part of a larger project on the deep history of postwar global capitalism that seeks to analyze international economic data to characterize the evolving structure of postwar global capitalist society.
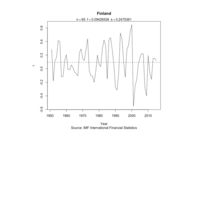
Finland
These plots show time series of the return rates on over 100 leading international stock indices. This is part of a larger project on the deep history of postwar global capitalism that seeks to analyze international economic data to characterize the evolving structure of postwar global capitalist society.
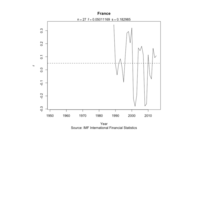
France
These plots show time series of the return rates on over 100 leading international stock indices. This is part of a larger project on the deep history of postwar global capitalism that seeks to analyze international economic data to characterize the evolving structure of postwar global capitalist society.
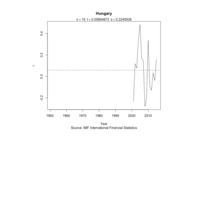
Hungary
These plots show time series of the return rates on over 100 leading international stock indices. This is part of a larger project on the deep history of postwar global capitalism that seeks to analyze international economic data to characterize the evolving structure of postwar global capitalist society.
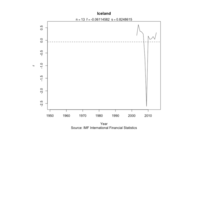
Iceland
These plots show time series of the return rates on over 100 leading international stock indices. This is part of a larger project on the deep history of postwar global capitalism that seeks to analyze international economic data to characterize the evolving structure of postwar global capitalist society.
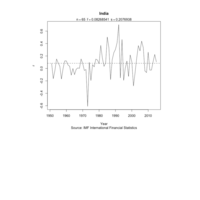
India
These plots show time series of the return rates on over 100 leading international stock indices. This is part of a larger project on the deep history of postwar global capitalism that seeks to analyze international economic data to characterize the evolving structure of postwar global capitalist society.

Iran
These plots show time series of the return rates on over 100 leading international stock indices. This is part of a larger project on the deep history of postwar global capitalism that seeks to analyze international economic data to characterize the evolving structure of postwar global capitalist society.
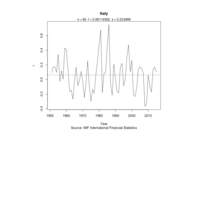
Italy
These plots show time series of the return rates on over 100 leading international stock indices. This is part of a larger project on the deep history of postwar global capitalism that seeks to analyze international economic data to characterize the evolving structure of postwar global capitalist society.

Japan
These plots show time series of the return rates on over 100 leading international stock indices. This is part of a larger project on the deep history of postwar global capitalism that seeks to analyze international economic data to characterize the evolving structure of postwar global capitalist society.
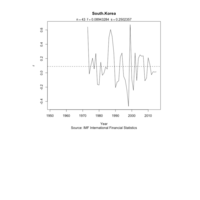
South Korea
These plots show time series of the return rates on over 100 leading international stock indices. This is part of a larger project on the deep history of postwar global capitalism that seeks to analyze international economic data to characterize the evolving structure of postwar global capitalist society.
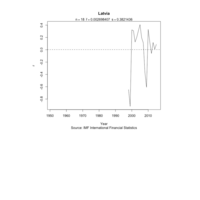
Latvia
These plots show time series of the return rates on over 100 leading international stock indices. This is part of a larger project on the deep history of postwar global capitalism that seeks to analyze international economic data to characterize the evolving structure of postwar global capitalist society.
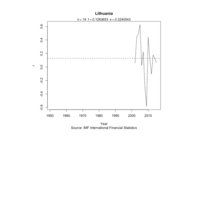
Lithuania
These plots show time series of the return rates on over 100 leading international stock indices. This is part of a larger project on the deep history of postwar global capitalism that seeks to analyze international economic data to characterize the evolving structure of postwar global capitalist society.
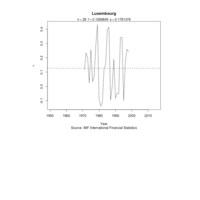
Luxembourg
These plots show time series of the return rates on over 100 leading international stock indices. This is part of a larger project on the deep history of postwar global capitalism that seeks to analyze international economic data to characterize the evolving structure of postwar global capitalist society.

Malaysia
These plots show time series of the return rates on over 100 leading international stock indices. This is part of a larger project on the deep history of postwar global capitalism that seeks to analyze international economic data to characterize the evolving structure of postwar global capitalist society.
Maldives
These plots show time series of the return rates on over 100 leading international stock indices. This is part of a larger project on the deep history of postwar global capitalism that seeks to analyze international economic data to characterize the evolving structure of postwar global capitalist society.
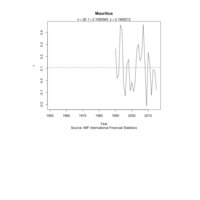
Mauritius
These plots show time series of the return rates on over 100 leading international stock indices. This is part of a larger project on the deep history of postwar global capitalism that seeks to analyze international economic data to characterize the evolving structure of postwar global capitalist society.
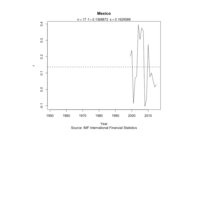
Mexico
These plots show time series of the return rates on over 100 leading international stock indices. This is part of a larger project on the deep history of postwar global capitalism that seeks to analyze international economic data to characterize the evolving structure of postwar global capitalist society.
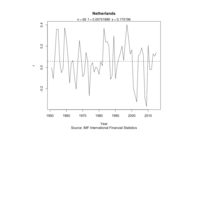
Netherlands
These plots show time series of the return rates on over 100 leading international stock indices. This is part of a larger project on the deep history of postwar global capitalism that seeks to analyze international economic data to characterize the evolving structure of postwar global capitalist society.
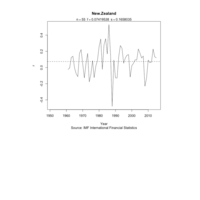
New Zealand
These plots show time series of the return rates on over 100 leading international stock indices. This is part of a larger project on the deep history of postwar global capitalism that seeks to analyze international economic data to characterize the evolving structure of postwar global capitalist society.
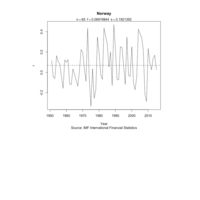
Norway
These plots show time series of the return rates on over 100 leading international stock indices. This is part of a larger project on the deep history of postwar global capitalism that seeks to analyze international economic data to characterize the evolving structure of postwar global capitalist society.
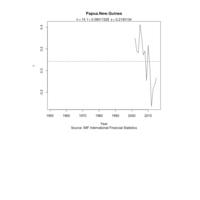
Papua New Guinea
These plots show time series of the return rates on over 100 leading international stock indices. This is part of a larger project on the deep history of postwar global capitalism that seeks to analyze international economic data to characterize the evolving structure of postwar global capitalist society.

Phillipines
These plots show time series of the return rates on over 100 leading international stock indices. This is part of a larger project on the deep history of postwar global capitalism that seeks to analyze international economic data to characterize the evolving structure of postwar global capitalist society.
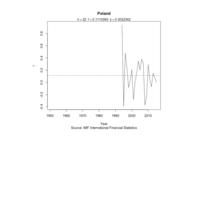
Poland
These plots show time series of the return rates on over 100 leading international stock indices. This is part of a larger project on the deep history of postwar global capitalism that seeks to analyze international economic data to characterize the evolving structure of postwar global capitalist society.
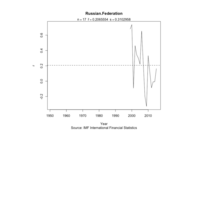
Russian Federation
These plots show time series of the return rates on over 100 leading international stock indices. This is part of a larger project on the deep history of postwar global capitalism that seeks to analyze international economic data to characterize the evolving structure of postwar global capitalist society.
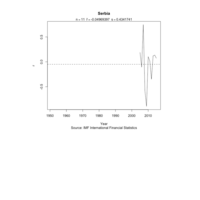
Serbia
These plots show time series of the return rates on over 100 leading international stock indices. This is part of a larger project on the deep history of postwar global capitalism that seeks to analyze international economic data to characterize the evolving structure of postwar global capitalist society.

Singapore
These plots show time series of the return rates on over 100 leading international stock indices. This is part of a larger project on the deep history of postwar global capitalism that seeks to analyze international economic data to characterize the evolving structure of postwar global capitalist society.
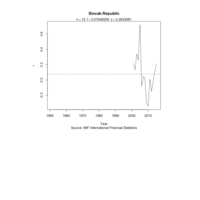
Slovak Republic
These plots show time series of the return rates on over 100 leading international stock indices. This is part of a larger project on the deep history of postwar global capitalism that seeks to analyze international economic data to characterize the evolving structure of postwar global capitalist society.
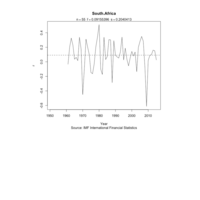
South Africa
These plots show time series of the return rates on over 100 leading international stock indices. This is part of a larger project on the deep history of postwar global capitalism that seeks to analyze international economic data to characterize the evolving structure of postwar global capitalist society.
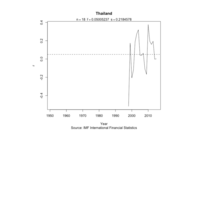
Thailand
These plots show time series of the return rates on over 100 leading international stock indices. This is part of a larger project on the deep history of postwar global capitalism that seeks to analyze international economic data to characterize the evolving structure of postwar global capitalist society.
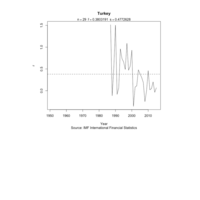
Turkey
These plots show time series of the return rates on over 100 leading international stock indices. This is part of a larger project on the deep history of postwar global capitalism that seeks to analyze international economic data to characterize the evolving structure of postwar global capitalist society.
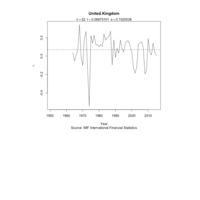
United Kingdom
These plots show time series of the return rates on over 100 leading international stock indices. This is part of a larger project on the deep history of postwar global capitalism that seeks to analyze international economic data to characterize the evolving structure of postwar global capitalist society.
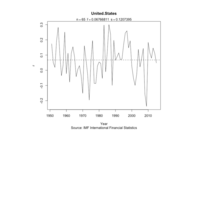
United States
These plots show time series of the return rates on over 100 leading international stock indices. This is part of a larger project on the deep history of postwar global capitalism that seeks to analyze international economic data to characterize the evolving structure of postwar global capitalist society.

West African EMU
These plots show time series of the return rates on over 100 leading international stock indices. This is part of a larger project on the deep history of postwar global capitalism that seeks to analyze international economic data to characterize the evolving structure of postwar global capitalist society.