Easy web publishing from R
Write
R Markdown
documents in RStudio.
Share them here on RPubs.
(It’s free, and couldn’t be simpler!)
Get Started
Recently Published

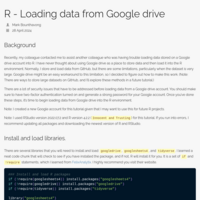
R - Loading data from Google drive
A tutorial on how to load data from Google drive into an R environment
Document
Good one

Lab-07-Code-Through-Kyaw (PAF-516 Spring 2024)
This code showcases the utilization of various R libraries, including ggplot2, dplyr, kable, kableExtra, scales, and plotly, to analyze and visualize air quality surveillance data from New York City.
Air quality is a critical issue, especially in densely populated areas like NYC, where it can have significant implications for public health. Through this code demonstration, we aim to unravel the complexities of air quality variations across different neighborhoods, providing valuable insights for environmental and health considerations.
A highlight of our exploration will be the utilization of plotly, known for its ability to create stunning geographical plots. We'll harness this capability to craft visually engaging scatter plots overlaid on maps, offering a dynamic perspective on air quality data throughout the city.
Additionally, we'll delve into kableExtra, a powerful tool for enhancing table formatting, ensuring that our visualizations not only convey information effectively but also captivate the viewer aesthetically.
Furthermore, we'll explore the robust capabilities of dplyr for efficient data manipulation, showcasing essential functions like filter, group_by, reframe, and arrange to tailor our analysis to specific requirements.
In summary, this code-through promises to be an enlightening journey into the world of data analysis and visualization in R. Whether you're a seasoned practitioner or just starting out, join us as we unravel the intricacies of air quality surveillance data through clear explanations and practical demonstrations.