
FJRubio
https://sites.google.com/site/fjavierrubio67/
Recently Published

PTCMGH R package: Promotion Time Cure Models with a General Hazard structure
The PTCMGH R package provides functions for simulating survival times from PTCMs with proportional hazards, accelerated failure time, and general hazard structures under a log-link for $\theta$, as well as for performing maximum likelihood estimation of these models.

The effect of the shape (skewness) parameter in skew-symmetric models, Part II
Based on a recently proposed discrepancy measures, showing that the effect of this parameter in some models, such as the skew-normal, is tiny in a neighbourhood of 0

On harmonic oscillator hazard functions
On harmonic oscillator hazard functions

Simulating times to event from a Life Table
The SimLT R package allows for simulating times to event based on the information in a life table.

HazReg: Parametric Excess Hazard-based regression models for survival data
The HazReg R package implements the following parametric excess hazard-based regression models for (relative) survival data: GH, PH, AFT, and AH.

Near Redundancy and Practical non-identifiability: Lung cancer data
Near Redundancy and Practical non-identifiability: Lung cancer data

Dynamic Survival Analysis: Modelling the Hazard Function via Ordinary Differential Equations. rotterdam data
Example 2 in "Dynamic Survival Analysis: Modelling the Hazard Function via Ordinary Differential Equations"

Near Redundancy and Practical non-identifiability: Leukemia data
Near Redundancy and Practical non-identifiability: Leukemia data

Dynamic Survival Analysis: Modelling the Hazard Function via Ordinary Differential Equations. LeukSurv data
Example 1 in "Dynamic Survival Analysis: Modelling the Hazard Function via Ordinary Differential Equations"
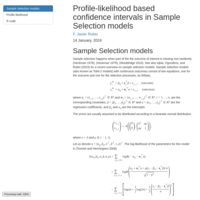
Profile-likelihood based confidence intervals in Sample Selection models
Profile-likelihood based confidence intervals in Sample Selection models

Simulacrum data - lung cancer: Individual Frailty Model
Individual frailty excess hazard models in cancer epidemiology. Example using The Simulacrum data set.

simGH: simulating times to event from a general hazard structure
simGH: simulating times to event from a general hazard structure using the HazReg R package.
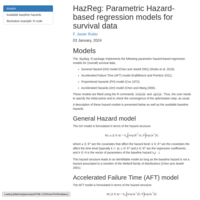
HazReg: Parametric Hazard-based regression models for survival data
The HazReg R package implements the following parametric hazard-based regression models for (overall) survival data: GH, PH, AFT, and AH.
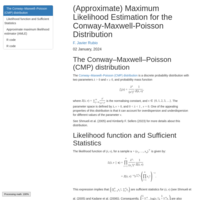
(Approximate) Maximum Likelihood Estimation for the Conway-Maxwell-Poisson Distribution
Maximum likelihood and Approximate maximum likelihood estimation of the parameters of the Conway-Maxwell-Poisson Distribution in R.
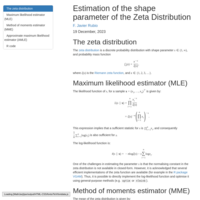
Estimation of the shape parameter of the Zeta Distribution
Maximum likelihood estimator (MLE), Method of moments estimator (MME), and Approximate maximum likelihood estimator (AMLE) of the shape parameter of the zeta distribution
Example 4: nki70 data set
Bayesian variable selection for survival data: Example 4
Example 3: colon cancer data set
Bayesian variable selection for survival data: Example 3
Example 2: flchain data set
Bayesian variable selection for survival data: Example 2
Example 1: Simulated data from an accelerated failure time model
Bayesian variable selection for survival data: Example 1
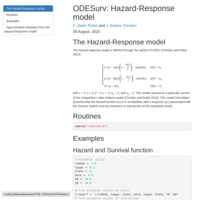
ODESurv: Hazard-Response model
Hazard-Response model and random number generation
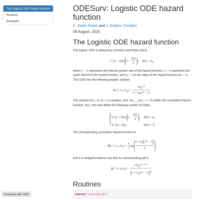
ODESurv: Logistic ODE hazard function
logisODE hazard, density, survival functions, and random number generation
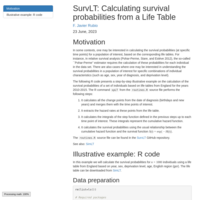
SurvLT: Calculating survival probabilities from a Life Table
Calculating survival probabilities from a Life Table
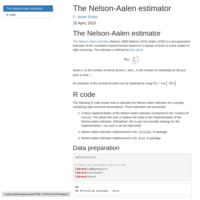
The Nelson-Aalen estimator
The Nelson-Aalen estimator
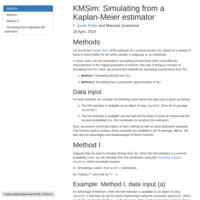
KMSim: Simulating from a Kaplan-Meier estimator
KMSim: Simulating from a Kaplan-Meier estimator
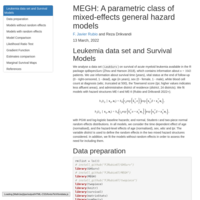
MEGH: A parametric class of mixed-effects general hazard models
MEGH: A parametric class of mixed-effects general hazard models
Leukemia data set and Survival Models
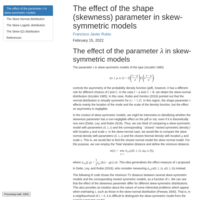
The effect of the shape (skewness) parameter in skew-symmetric models
The effect of the shape (skewness) parameter in skew-symmetric models based on the TV distance
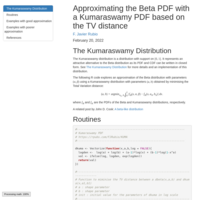
Approximating the Beta PDF with a Kumaraswamy PDF based on the TV distance
Approximating the Beta PDF with a Kumaraswamy PDF based on the TV distance
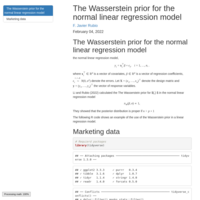
The Wasserstein prior for the normal linear regression model
The Wasserstein prior for the normal linear regression model
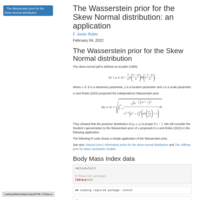
The Wasserstein prior for the Skew Normal distribution: an applicationDocument
The Wasserstein prior for the Skew Normal distribution: an application
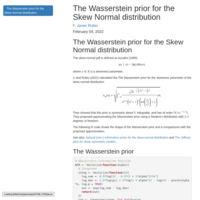
The Wasserstein prior for the Skew Normal distribution
The Wasserstein prior for the Skew Normal distribution
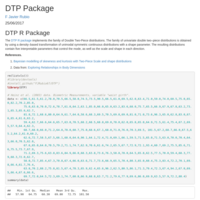
DTP Package
DTP R Package
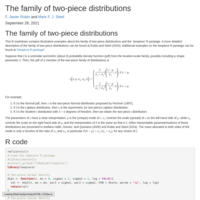
The family of two-piece distributions
This R markdown contains illustrative examples about the family of two-piece distributions and the "twopiece" R package.
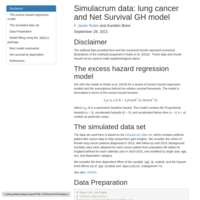
Simulacrum data: lung cancer and Net Survival GH model
Net survival example using the R package GHSurv

A unifying framework for flexible excess hazard modelling with applications in cancer epidemiology: Leukemia data
A unifying framework for flexible excess hazard modelling with applications in cancer epidemiology: Leukemia data

A unifying framework for flexible excess hazard modelling with applications in cancer epidemiology: The Simulacrum
A unifying framework for flexible excess hazard modelling with applications in cancer epidemiology: The Simulacrum
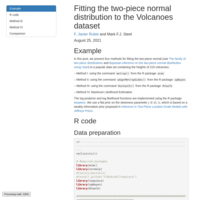
Fitting the two-piece normal distribution to the Volcanoes dataset
Fitting the two-piece normal distribution to the Volcanoes dataset using 4 methods.
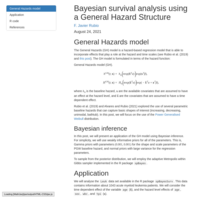
Bayesian survival analysis using a General Hazard Structure
Bayesian survival analysis using a General Hazard Structure
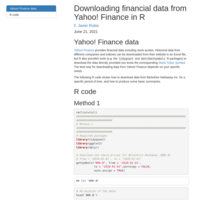
Downloading financial data from Yahoo! Finance in R
Using the R packages tidyquant and BatchGetSymbols.
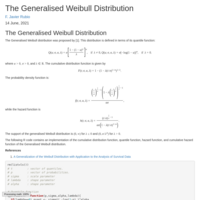
The Generalised Weibull Distribution
Cumulative distribution function, quantile function, hazard function, and cumulative hazard function of the Generalised Weibull distribution.

The Exponentiated Weibull distribution
Probability density function, cumulative distribution function, quantile function, random number generation, hazard function, and cumulative hazard function of the Exponentiated Weibull distribution.
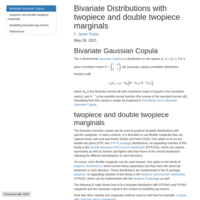
Bivariate Distributions with twopiece and double twopiece marginals
Modelling bivariate log returns using a Gaussian copula with twopiece and double twopiece marginals
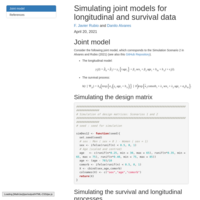
Simulating joint models for longitudinal and survival data
Algorithms and code for simulating from joint models for longitudinal and survival data with time dependent effects.
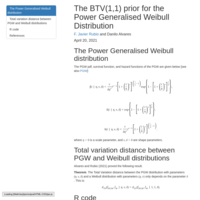
The BTV(1,1) prior for the Power Generalised Weibull Distribution
The BTV(1,1) prior for the Power Generalised Weibull Distribution
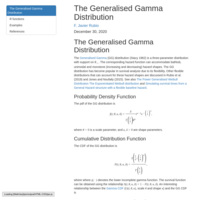
The Generalised Gamma Distribution
The Generalised Gamma Distribution and a link with the Gamma Distribution
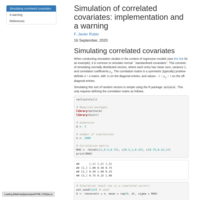
Simulation of normal corrrelated covariates: implementation and a warning
Simulation of normal corrrelated covariates: implementation and a warning about the correlation matrix
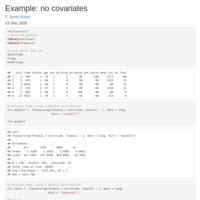
Example: no covariates
Parametric Survival Models
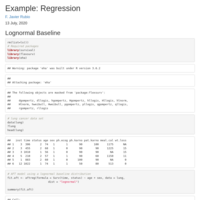
Example: Survival Regression Models
Parametric Survival Regression Models
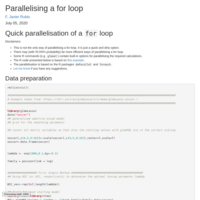
Quick parallelisation of a for loop
Quick and dirty parallelisation of a for loop
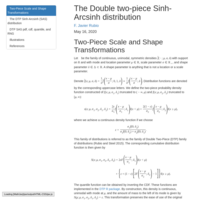
The Double two-piece Sinh-Arcsinh distribution
Implementation of the pdf, cdf, quantile function, and random number generation of the DTP SAS distribution using the DTP R package.
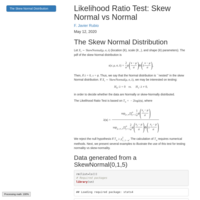
Likelihood Ratio Test: Skew Normal vs Normal
Likelihood Ratio Test: Skew Normal vs Normal
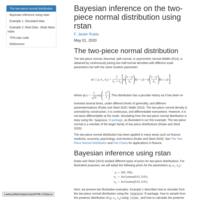
Bayesian inference on the two-piece normal distribution using rstan
Bayesian inference on the two-piece normal distribution using rstan. Simulated and Real Data applications.
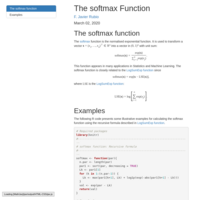
The softmax Function
Implementation of the softmax function using the recursive formula.

The Hyperbolic Secant Distribution
pdf, the cdf, the quantile function, random number generation, and moments associated to the Hyperbolic Secant distribution.
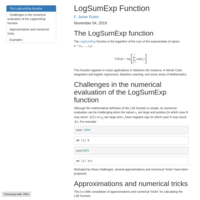
The LogSumExp function
The LogSumExp function is the logarithm of the sum of the exponentials of n values. This R Markdown presents 5 methods to calculate the LogSumExp function.

The Power Generalised Weibull Distribution
The Power Generalised Weibull Distribution in R: a three-parameter distribution with positive support and flexible hazard function.
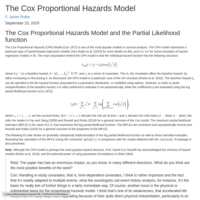
The Cox Proportional Hazards Model and the Partial Likelihood function
The Cox Proportional Hazards Model and the Partial Likelihood function
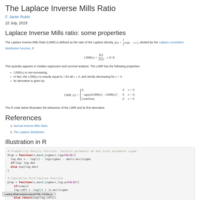
The Laplace Inverse Mills Ratio
R code and illustrations of the behaviour of the Laplace Inverse Mills Ratio (LIMR) and its first derivative.
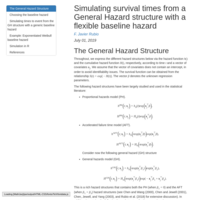
Simulating survival times from a General Hazard structure with a flexible baseline hazard
This tutorial shows how to simulate from a General Hazard structure that includes time dependent effects as well as effects that only affect the hazard level.
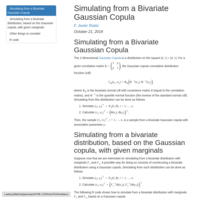
Simulating from a Bivariate Gaussian Copula
R code to simulate from a bivariate distribution based on a Gaussian copula

The Kumaraswamy Distribution
pdf, the cdf, the quantile function, random number generation, and moments associated to the Kumaraswamy distribution.
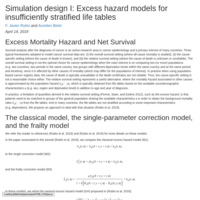
Excess hazard models for insufficiently stratified life tables
A simulated data example
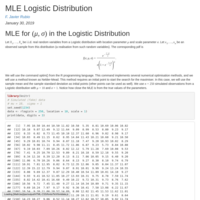
MLE Logistic Distribution
MLE for the location and scale parameters in the Logistic Distribution
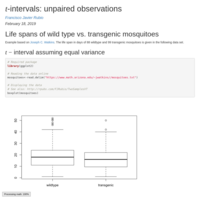
t-intervals: unpaired observations
Life spans of wild type vs. transgenic mosquitoes
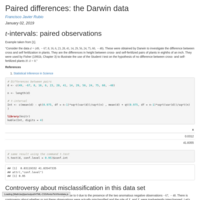
Paired differences: the Darwin data
t-intervals: paired observations
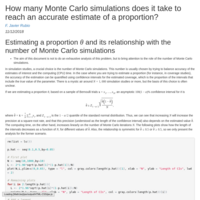
How many Monte Carlo simulations to get to an accurate estimate of a proportion?
Estimating a proportion $\theta$ and its relationship with the number of Monte Carlo simulations
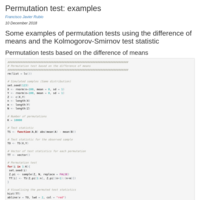
Permutation test: examples
Some examples of permutation tests using the difference of means and the Kolmogorov-Smirnov test statistic
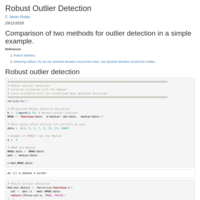
Robust Outlier Detection
Robust Outlier Detection vs. Non-Robust Outlier Detection
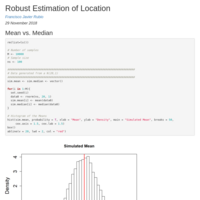
Robust Estimation of Location
Mean vs. Median
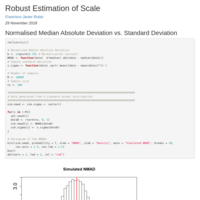
Robust Estimation of Scale
Normalised Median Absolute Deviation vs. Standard Deviation
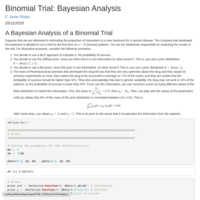
Binomial Trial: Bayesian Analysis
A Bayesian Analysis of a Binomial Trial.
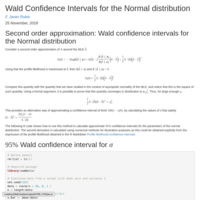
Wald Confidence Interval for the Normal distribution
Second order approximation: Wald confidence intervals for the Normal distribution

A Brief analysis of the Challenger data
Analysis of the Challenger disaster data using logistic regression
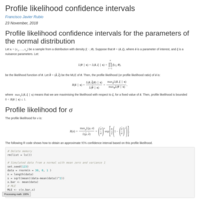
Profile likelihood confidence intervals for the parameters of the normal distribution
Profile likelihood confidence intervals for the parameters of the normal distribution (mean and standard deviation)
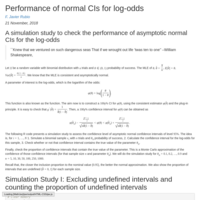
Performance of normal Confidence Intervals for log-odds
A simulation study to check the performance of asymptotic normal CIs for the log-odds

Method of moments for the Kumaraswamy distribution
An example where the Method of Moments does not lead to a closed form solution and requires the use of numerical methods to obtain a solution to the corresponding estimating equations.
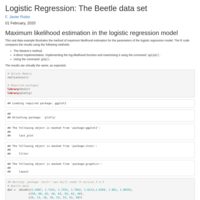
Logistic Regression: The Beetle data set
Maximum likelihood estimation in the logistic regression model
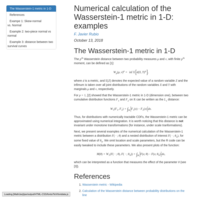
Numerical calculation of the Wasserstein-1 metric in 1-D: examples
Three examples of the numerical calculation of the Wasserstein-1 metric, including its use for comparing survival curves.
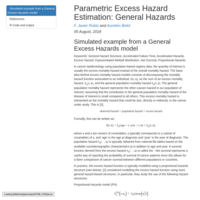
Parametric Excess Hazard Estimation: General Hazards
This R code illustrates the use of General Hazard structure models in a simulated data set. The data set was simulated using the General Hazards (GH) structure. The idea is to fit the parametric regression models with hazard structures PH, AH, AFT, and GH and select the one favoured by the Akaike Information Criterion (AIC).
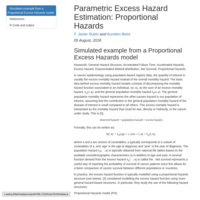
Parametric Excess Hazard Estimation: Proportional Hazards
This R code illustrates the use of General Hazard structure models in a simulated data set. The data set was simulated using the Proportional Hazards (PH) structure. The idea is to fit the parametric regression models with hazard structures PH, AH, AFT, and GH and select the one favoured by the Akaike Information Criterion (AIC).
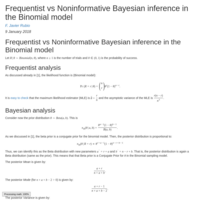
Frequentist vs Noninformative Bayesian inference in the Binomial model
Frequentist vs Noninformative Bayesian inference in the Binomial model using Uniform and Jeffreys priors.
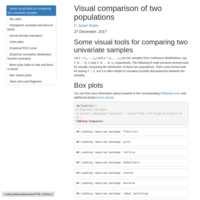
Visual comparison of two populations
Some visual tools for comparing two univariate samples

Flexible linear mixed models: HIV-1 viral load after unstructured treatment interruption
A real data example of linear mixed models for censored responses with flexible random effects and flexible residual errors.

Flexible linear mixed models: Framingham study
A real data application of linear mixed models with flexible errors and flexible random effects.

How to create a random Secret Santa list in R
Two different methods to create a Secret Santa random list in R from a list of names.
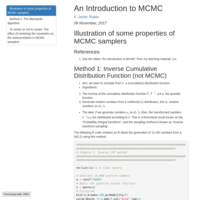
An Introduction to MCMC
Illustration of some properties of MCMC samplers
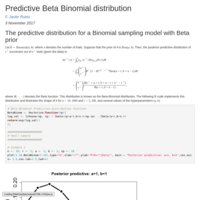
Predictive Beta Binomial distribution
The predictive distribution for a Binomial sampling model with Beta prior.

The Normal-Normal Bayesian model (known variance)
The posterior distribution of the mean for a normal sampling model with known variance and normal prior distribution
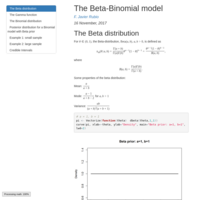
The Beta-Binomial model
A short description of the Binomial distribution, the Beta distribution, and the Bayesian Beta-Binomial model.
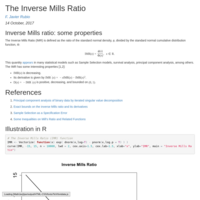
The Inverse Mills Ratio
Some properties of the Inverse Mills Ratio
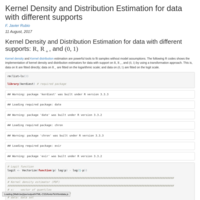
Kernel Density and Distribution Estimation for data with different supports
R codes to implement kernel density and distribution estimators for data with support on R, R_+, and (0,1) by using a transformation approach.
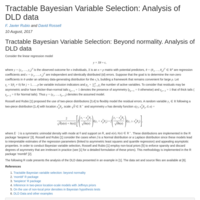
Bayesian Variable Selection: Analysis of DLD data
Tractable Bayesian Variable Selection: Beyond normality. Analysis of DLD data using two-piece residual errors and non-local priors.

An objective prior for the number of degrees of freedom of a multivariate t distribution
An objective prior for the number of degrees of freedom of a multivariate t distribution

The Jeffreys prior for skew–symmetric models
The Jeffreys prior for the skewness parameter in skew–symmetric models

Kullback Leibler divergence between a multivariate t and a multivariate normal distributions
A tractable, scalable, expression for the Kullback Leibler divergence between a multivariate t and a multivariate normal distributions

Kullback Leibler divergence between two multivariate t distributions
A tractable, scalable, expression for the Kullback Leibler divergence between two multivariate t distributions

An application of an objective prior for the number of degrees of freedom of a multivariate t distribution
A financial application of an objective prior for the number of degrees of freedom of a multivariate t distribution
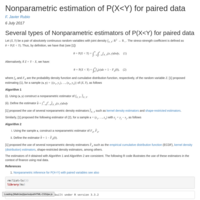
Nonparametric estimation of P(X<Y) for paired data
Several types of Nonparametric estimators of P(X<Y) for paired data
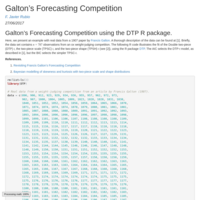
Galton’s Forecasting Competition
Galton’s Forecasting Competition data modelling using the DTP R package.
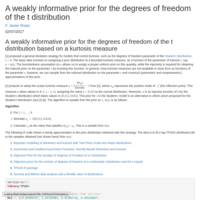
A weakly informative prior for the degrees of freedom of the t distribution
Implementation of a weakly informative prior for the degrees of freedom of the t distribution.

Mollified two-piece distributions
Mollification of two-piece distributions.

The Laplace and two-piece Laplace Distributions
Implementation of the Laplace and two piece Laplace distributions (using the R package twopiece).

Natural (non-) informative priors for the skew-normal distribution
Real data example to illustrate the use of Jeffreys and Total Variation priors for the shape parameter of the skew-normal distribution

t-copula with t and two piece t marginals
A real data example to illustrate how to fit a t-copula with t and two piece t marginals
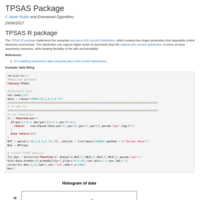
TPSAS R Package
The TPSAS R package implements the univariate two-piece sinh–arcsinh distribution
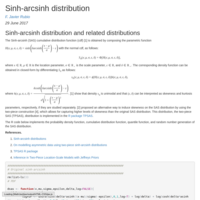
Sinh-arcsinh distribution
Implementation of the probability density function, cumulative distribution function, quantile function, and random number generation of the SAS distribution.
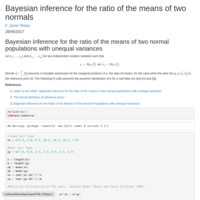
Bayesian inference for the ratio of the means of two normals
Bayesian inference for the ratio of the means of two normal populations with unequal variances using reference priors.
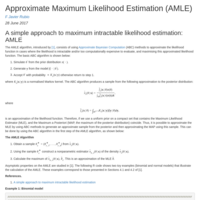
Approximate Maximum Likelihood Estimation (AMLE)
A simple approach to maximum intractable likelihood estimation: AMLE. Two toy examples.
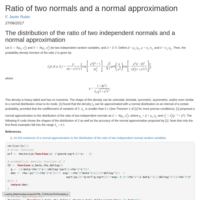
Ratio of two normals and a normal approximation
Implementaion of the distribution of the ratio of two independent normal distributions and a normal approximation.

Posterior QQ envelopes: normality test
Implementation of Posterior QQ envelopes for normality test.
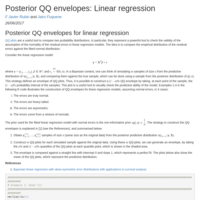
Posterior QQ envelopes: Linear regression
Implementation of Posterior QQ envelopes and predictive QQ plots in the context of linear regression.

Flexible AFT Models III: Bayesian + two-piece
Bayesian AFT models with two-piece errors
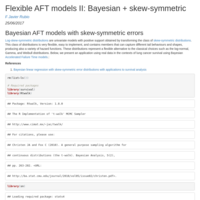
Flexible AFT Models II: Bayesian + skew-symmetric
Bayesian Accelerated Failure Time models with skew-symmetric errors.
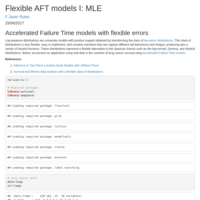
Flexible AFT Models I: MLE + two-piece
Accelerated failure time models with two-piece errors using maximum likelihood estimation.
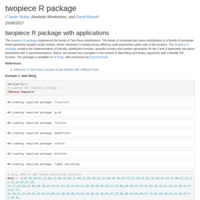
twopiece R package with applications
The twopiece R package implements the family of Two-Piece distributions.

Two-piece Generalised Hyperbolic distribution
Description and implementation of the two-piece Generalised Hyperbolic distribution.
Two-piece Variance Gamma distribution
Implementation and description of the two-piece Variance Gamma distribution.

Two-piece Johnson-SU distribution
Implementation and description of the two-piece Johnson-SU distribution