
Aakansha_garg
aakansha garg
Recently Published

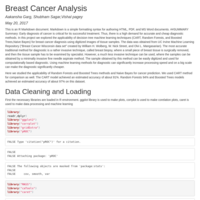
Breast Cancer Data Analysis using R
breast cancer data analysis using Boosted tree, Cart model, Random Forest, Naive Bayes
The data is Wisconsin Data

Document
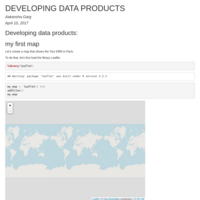
MAP USING LEAFLET
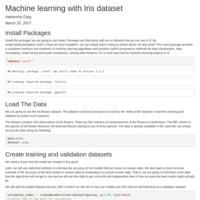
Machine Learning using Iris dataset in R
How to start analyzing dataset+ machine learning algorithms+various machine learning algo+ analyzing the best one
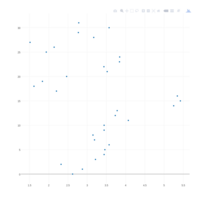
How to use plot_ly
plotly is used to create interactive web graphics in R
Here mtcars dataset is used and the variables used for plotting the scatterplot is wt as X and mpg as Y, with mode=marker