
AhmedEzatElZowalaty
Ahmed Ezat El Zowalaty
Recently Published
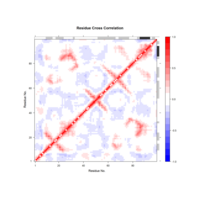
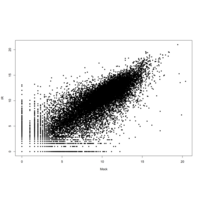
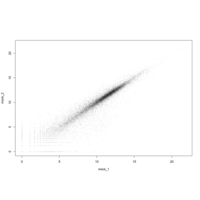
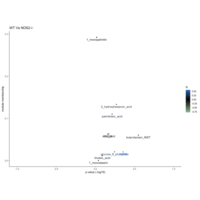
Cross-correlation analysis
Cross-correlation analysis
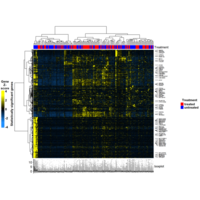
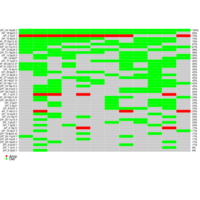
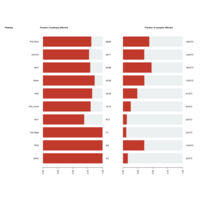
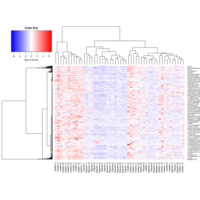
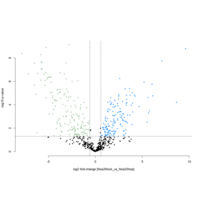
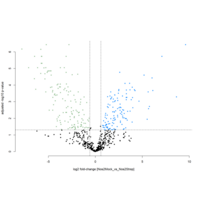
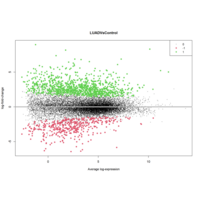
DE genes in lung primary tumor tissue from cisplatin-treated and untreated LUAD patients
Upregulated and downregulated genes in lung primary tumor tissue from cisplatin-treated and untreated LUAD patients.
Data source TCGA
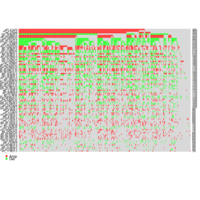
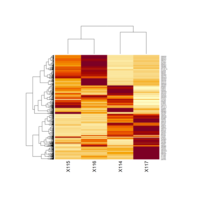
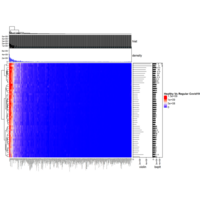
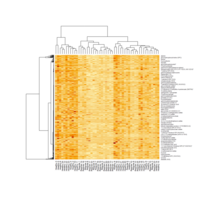
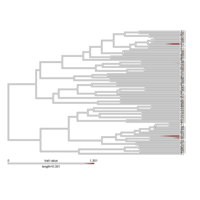
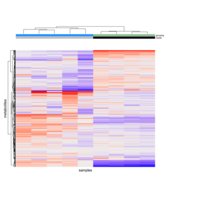
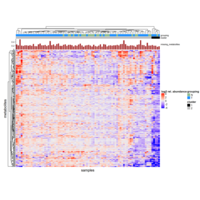
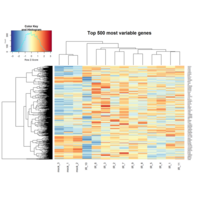
Hierarchical clustering pheatmap
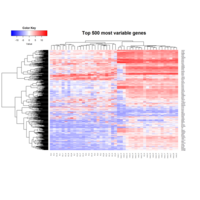
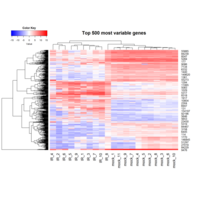
Hierarchical clustering pheatmap of top 500 most variable genes in basal and luminal mammary epithelium.

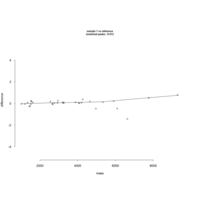
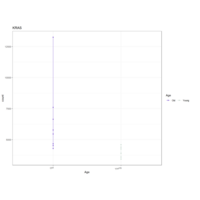
QQ plot
Correlation between male and female treated-mice weight data and the normal distribution
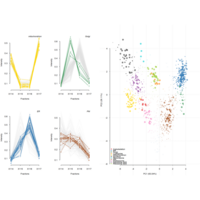
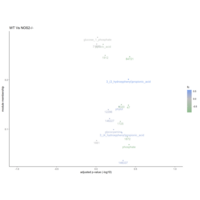
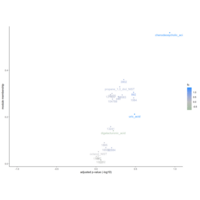
GO clusters semantic similarities heatmap
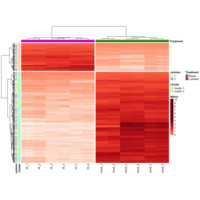
Primary tumors from NAC, VItE and Control-treated mouse model of melanoma
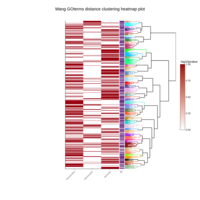
WANG Gene Ontology terms distance clustering heatmap
Primary tumors from NAC Vs Control-treated mouse model of melanoma
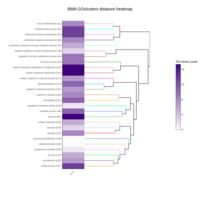
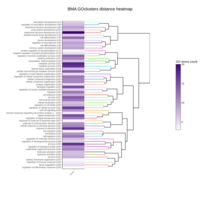
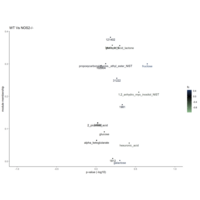
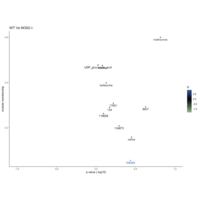
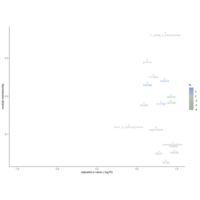
GO clusters semantic similarities heatmap
Primary tumors from NAC Vs Control-treated mouse model of melanoma
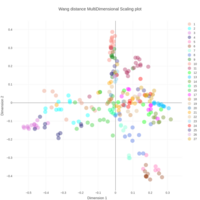
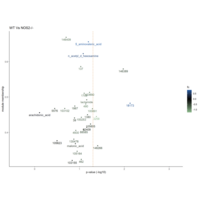
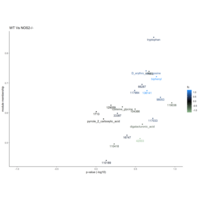
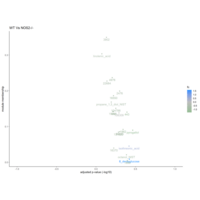
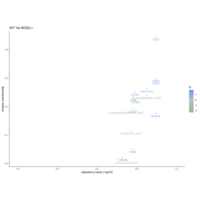
Multi Dimensional Scaling of GO terms
Primary tumors from NAC Vs Control-treated mouse model of melanoma
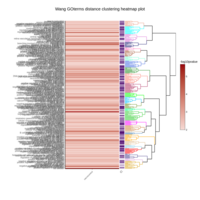
WANG Gene Ontology terms distance clustering heatmap
Primary tumors from NAC Vs Control-treated mouse model of melanoma
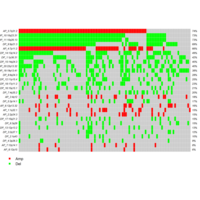
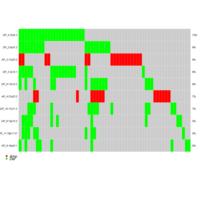
GISTIC oncoplot
GISTIC oncoplot of deleted and amplified genomic regions in Lung Adenocarcinoma
GISTIC oncoplot
GISTIC oncoplot of deleted and amplified genomic regions in Liver Hepatocellular Carcinoma

GISTIC oncoplot
GISTIC oncoplot of deleted and amplified genomic regions in Lung Squamous Cell Carcinoma.
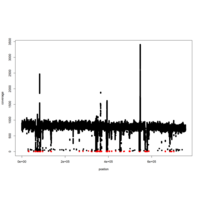
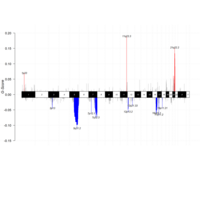
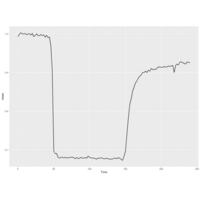
Segments identified by CBS. The TCN signals with the TCN mean levels (purple).
Segments identified by CBS. The TCN signals with the TCN mean levels (purple).

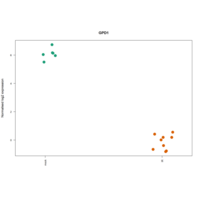
Expression of KRAS and TP53 across three diffeent cancers.
Source: TCGA data

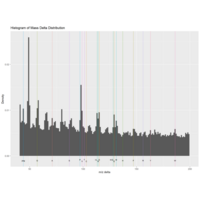
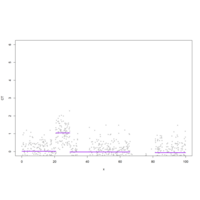
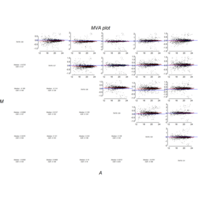
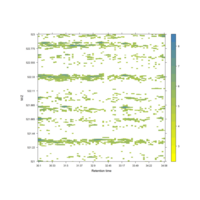
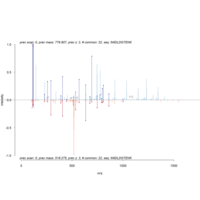
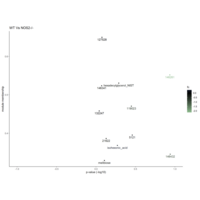
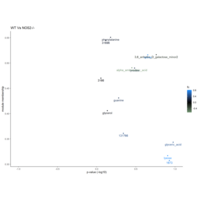
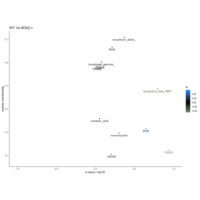
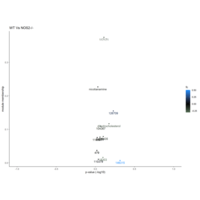
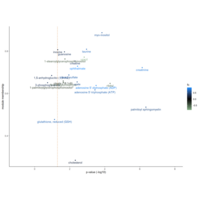
A m/z delta plot
A m/z delta plot.
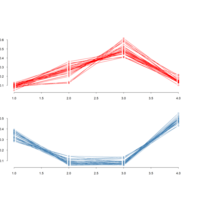
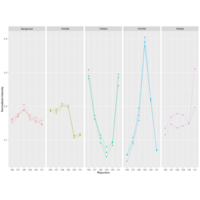
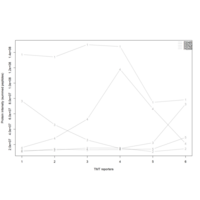
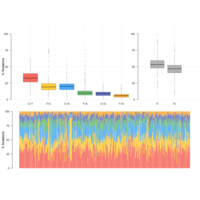
Line plots that describe the protein quantitative profiles for two sets of proteins, ER and mitochondrial proteins using matplot.
Line plots that describe the protein quantitative profiles for two sets of proteins, ER and mitochondrial proteins using matplot.
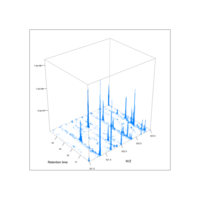
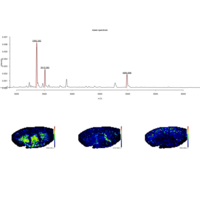
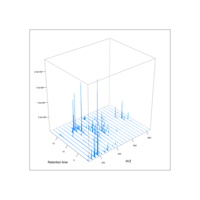
Visualizing MS2 spectra using MSnbase
The figure shows the raw data of a spectrum of interest and the iTRAQ 4-plex reporter ions (in profile mode)
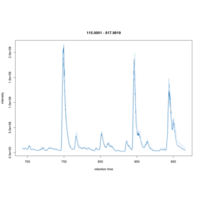
Visualizing MS2 spectra using MSnbase
The figure compares the centroided spectrum shown on the left (blue, top) with another acquisition of the same peptides (red, bottom). Shared peaks (in bold) and diagnostic y and b fragments are highlighted
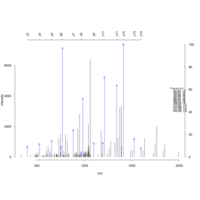
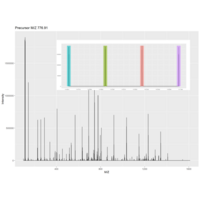
Visualizing MS2 spectra using protViz
The spectrum was produced with protViz's peakplot function.
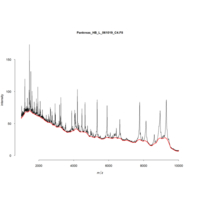
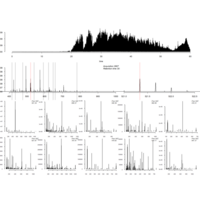
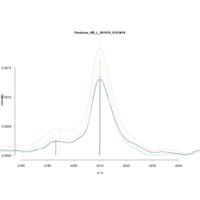
MALDIquant preprocessing pipeline
The figure shows a raw spectrum with the estimated baseline.
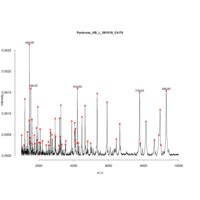
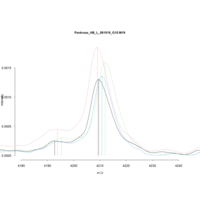
MALDIquant preprocessing pipeline
The figure shows a merged spectrum with discovered and labelled peaks
MALDIquant preprocessing pipeline
Four peaks are shown after performing the alignment
MALDIquant preprocessing pipeline
Four peaks are shown before performing the alignment.
MALDIquant preprocessing pipeline
The figure is an example of a fitted warping function for peak alignment.
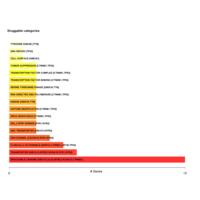
Plot of drug–gene interactions in liver cancer
Drug–gene interactions and gene druggability information compiled from Drug Gene Interaction database.
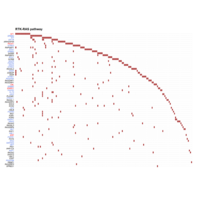
RTK-RAS oncogenic signaling pathway plot in liver cancer
RTK-RAS oncogenic signaling pathway plot in liver cancer

Plot of Somatic Interactions in Liver Cancer
The plot displays mutually exclusive genes.
Pair-wise Fisher’s Exact used to test significant pair of genes
Liver cancer genome plot
Liver cancer genome plot
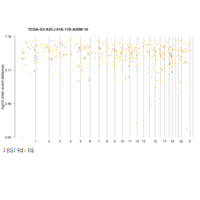
Rainfall plot of a liver cancer sample
Cancer genomes are characterized by genomic loci with localized hyper-mutations. Such hyper mutated genomic regions are visualized by plotting inter variant distance on a linear genomic scale.
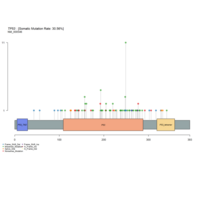
Lollipop plots for amino acid changes in TP53 in liver cancer
LollipopPlot function requires us to have amino acid changes information in lollipop plot displays amino acid changes in TP53 protein.
Liver cancer Transition and Transversions
SNPs classified into Transitions and Transversions
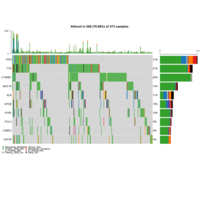
Liver cancer Oncoplot
Liver cancer Oncoplot
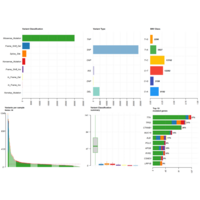
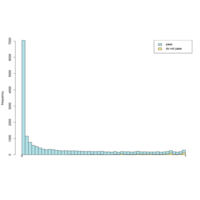
MAF summary
Plot of the summary of the liver cancer maf file, it displays number of variants in each sample as a stacked barplot and variant types as a boxplot.


Investigate any systematic bias in the sequencing data
KRAS LUAD Old Vs Young
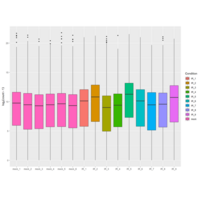
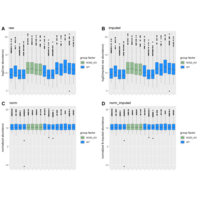
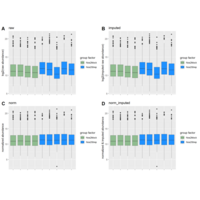
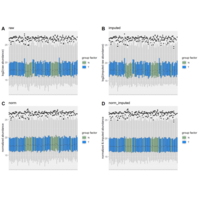
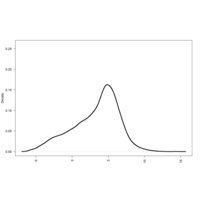
Distribution of counts
KRAS LUAD Old Vs Young
Pseudo counts in Mock Vs IR
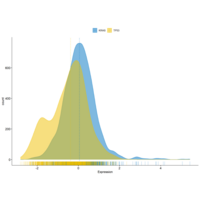
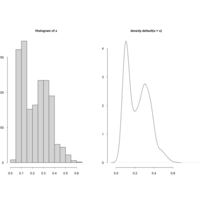
KRAS LUAD Old Vs Young
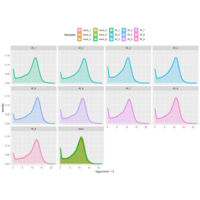
Density Plots of count destribution
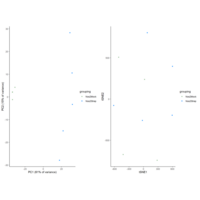
KRAS LUAD Old Vs Young

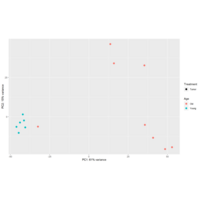
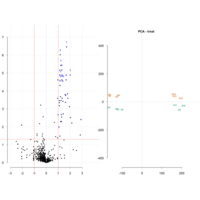
PCA Plot
KRAS LUAD Old Vs Young

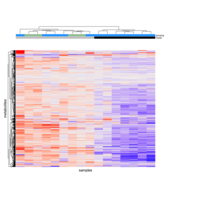
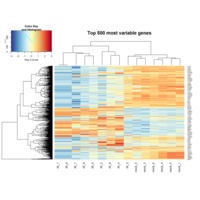
Heatmap of differentially expressed genes
KRAS LUAD Old Vs Young
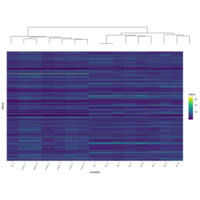
Heatmap of differentially expressed genes
KRAS LUAD Old Vs Young
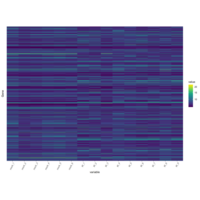
Heatmap of differentially expressed genes
KRAS LUAD Old Vs Young
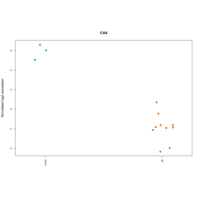
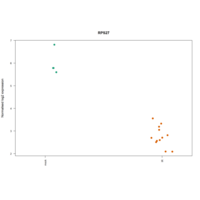
Expression of KRAS in samples
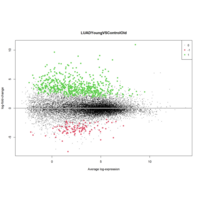
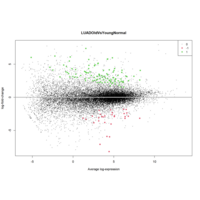
KRAS LUAD Old Vs Young
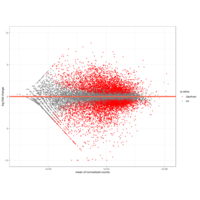
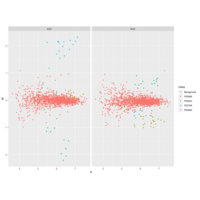
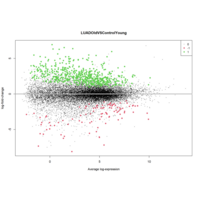
MA Plot
KRAS LUAD Old Vs Young
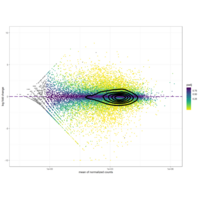
MA Plot Contour
KRAS LUAD Old Vs Young

Heatmap of differentially expressed genes
KRAS LUAD Old Vs Young
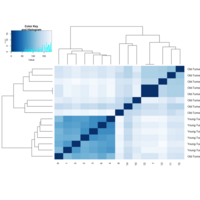
Distance Heatmap
KRAS LUAD Old Vs Young
Dispersion
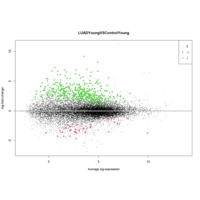
KRAS LUAD Old Vs Young
MA Plot
KRAS LUAD Old Vs Young
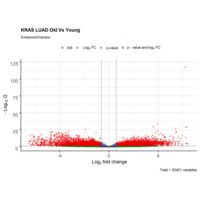
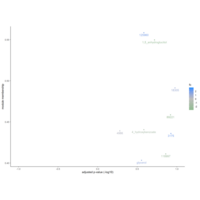
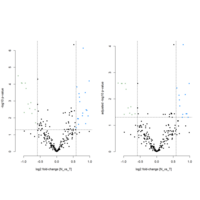
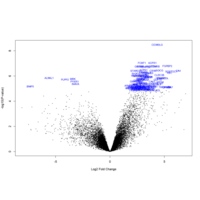
Enhanced Volcano Plot
KRAS LUAD Old Vs Young
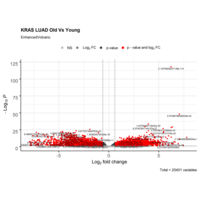
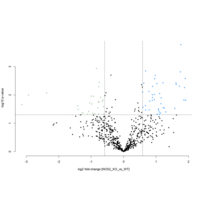
Volcano Plot
KRAS LUAD Old Vs Young


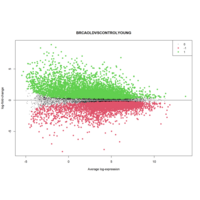
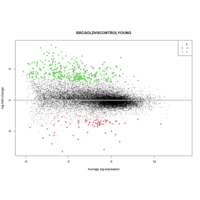
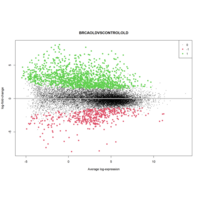
Heat map of BRCA Old Samples Vs Control OLD Samples
Heatmap of differentially-expressed genes of Breast Cancer Old patients (N=24) RNA seq Vs Control Old Normal Breast (N=20) RNA seq.
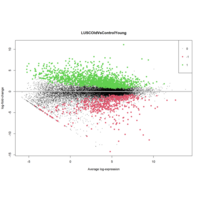


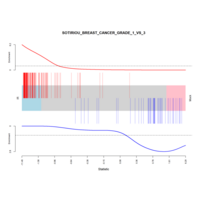
LUSC Young Vs Control Old
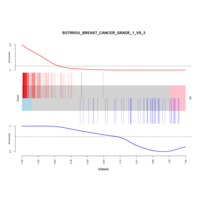
SOTIRIOU_BREAST_CANCER_GRADE_1_VS_3_DN
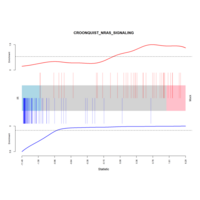
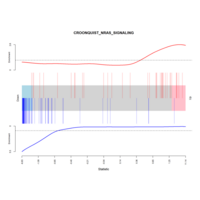
LUSC Young Vs Control Old
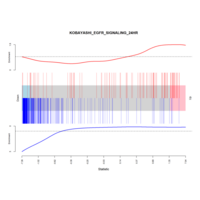
CROONQUIST NRAS SIGNALING
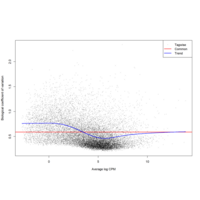
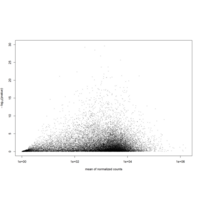
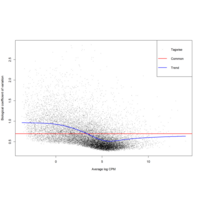
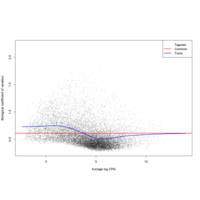
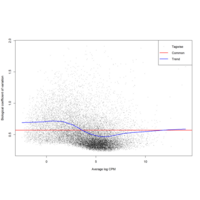
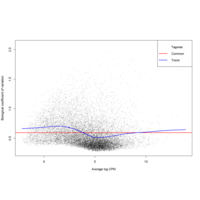
Scatterplot of the biological coefficient of variation (BCV) against the average abundance of each gene
LUSC Young Patient samples Vs. Control Old Samples
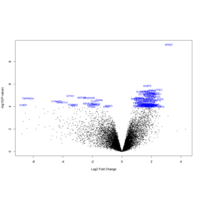
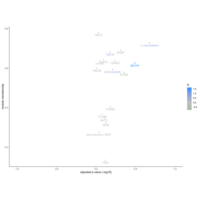
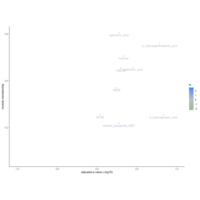
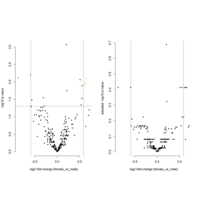
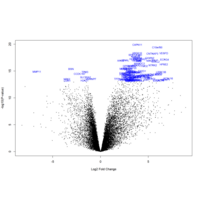
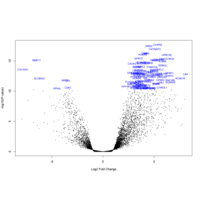
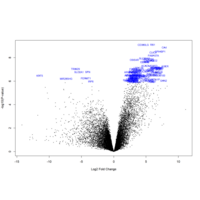
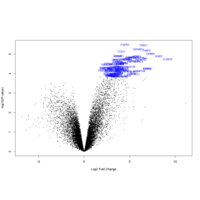
Volcano Plot of DE genes in PAAD Vs Control
Volcano Plot of differentially-expressed genes of mRNA Seq data of Pancreatic Adenocarcinoma "PAAD" (primary solid tumor samples) Vs Normal solid pancreatic tissue samples "Control"
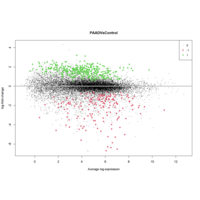
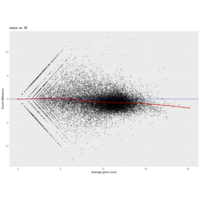
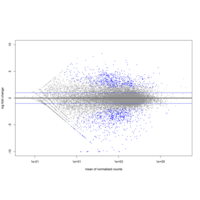
MD Plot of differentially-expressed genes in PAAD Vs Control
MD Plot of differentially-expressed genes of mRNA Seq data of Pancreatic Adenocarcinoma "PAAD" (primary solid tumor samples) Vs Normal solid pancreatic tissue samples "Control" at Log 2 Fold Change = 0.3
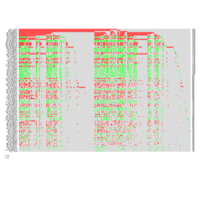
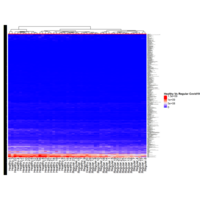
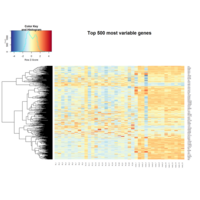
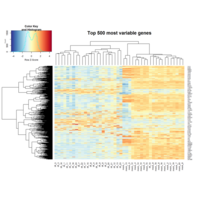
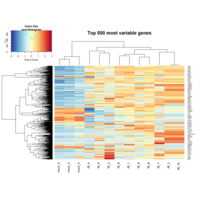
Heat Map of 500 Most Variable Genes in PAAD Vs Control
Heat Map of 500 Most Variable Genes in pancreatic Adenocarcinoma Vs Control
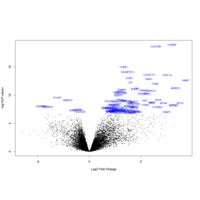
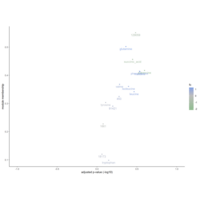
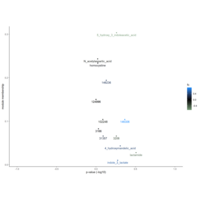
Volcano Plot of DE genes in LHCC Vs Control
Volcano Plot of differentially-expressed genes of mRNA Seq data of Liver Hepatocellular Carcinoma "LHCC" (primary solid tumor samples) Vs Normal solid liver tissue samples "Control"
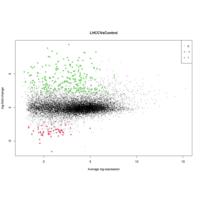
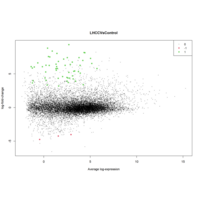
MD Plot 2 of LHCC Vs Control
MD Plot of differentially-expressed genes of mRNA Seq data of Liver Hepatocellular Carcinoma "LHCC" (primary solid tumor samples) Vs Normal solid liver tissue samples "Control" at Log 2 Fold Change = 1
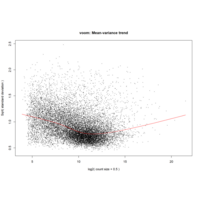
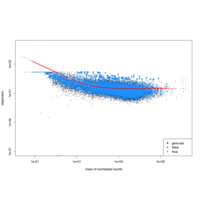
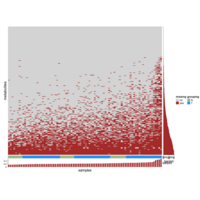
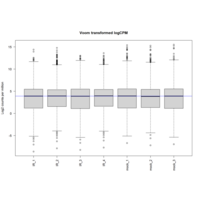
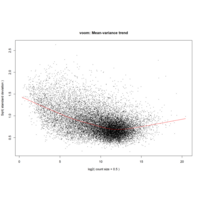
Voom: Mean variance Trend for for LHCC Vs Control
Voom: Mean variance Trend for for LHCC Vs Control
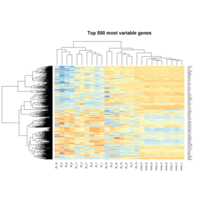
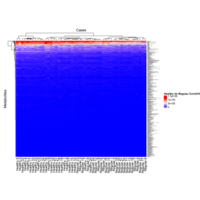
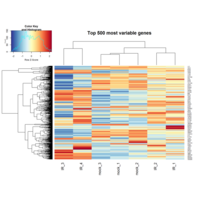
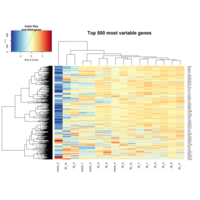
Heat Map of 500 Most Variable Genes in LHCC Vs Control
Heat Map of 500 Most Variable Genes in LHCC compared to control.
MD Plot of LHCC Vs Control
MD Plot of differentially-expressed genes of mRNA Seq data of Liver Hepatocellular Carcinoma "LHCC" (primary solid tumor samples) Vs Normal solid liver tissue samples "Control" at Log 2 Fold Change = 2
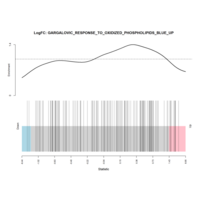
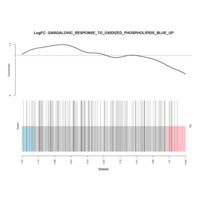
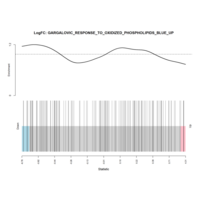
Barcode Plot 3 LUAD Vs Control
GARGALOVIC_RESPONSE_TO_OXIDIZED_PHOSPHOLIPIDS_BLUE_UP
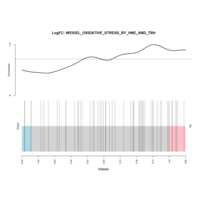
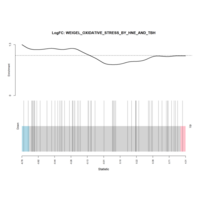
Barcode Plot 2 LUAD Vs Control
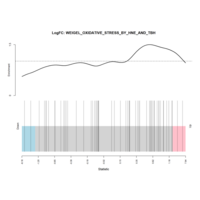
WEIGEL_OXIDATIVE_STRESS_BY_HNE_AND_TBH
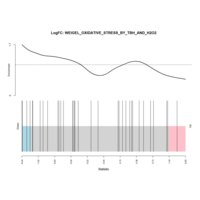
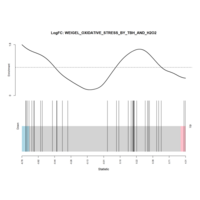
Barcode Plot 1 LUAD Vs Control
WEIGEL_OXIDATIVE_STRESS_BY_TBH_AND_H2O2
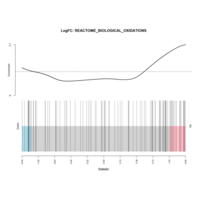
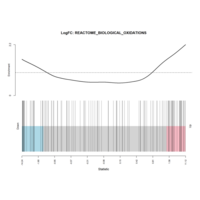
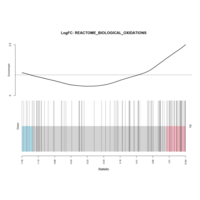
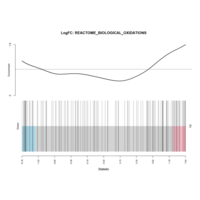
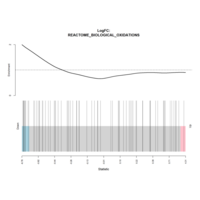
Barcode Plot 6 LUAD Vs Control
REACTOME_BIOLOGICAL_OXIDATIONS

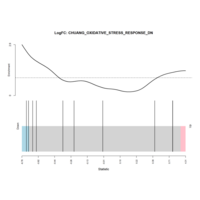
Barcode Plot 5 LUAD Vs Control
CHUANG_OXIDATIVE_STRESS_RESPONSE_DN
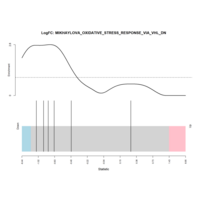
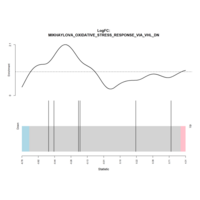
Barcode Plot 4 LUAD Vs Control
MIKHAYLOVA_OXIDATIVE_STRESS_RESPONSE_VIA_VHL_DN
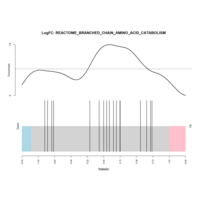
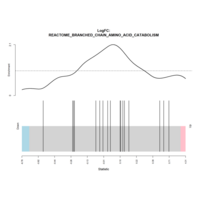
Barcode Plot 7 LUAD Vs Control
REACTOME_BRANCHED_CHAIN_AMINO_ACID_CATABOLISM
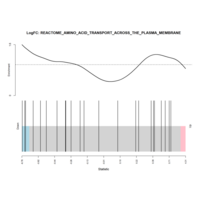
Barcode Plot 8 LUAD Vs Control
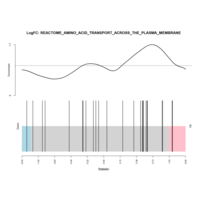
REACTOME_AMINO_ACID_TRANSPORT_ACROSS_THE_PLASMA_MEMBRANE
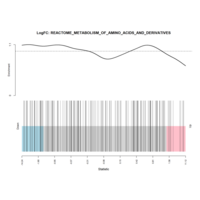
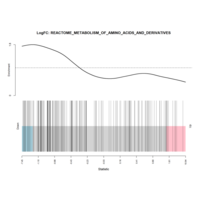
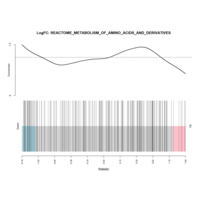
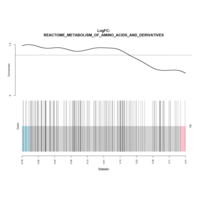
Barcode Plot 9 LUAD Vs Control
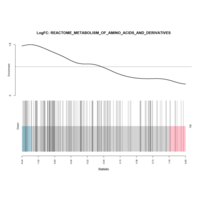
REACTOME_METABOLISM_OF_AMINO_ACIDS_AND_DERIVATIVES
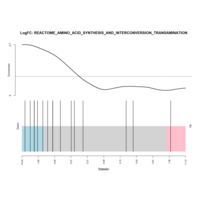
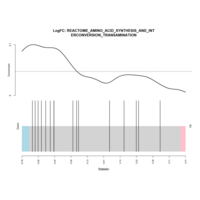
Barcode Plot 10 LUAD Vs Control
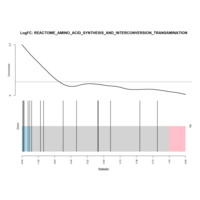
REACTOME_AMINO_ACID_SYNTHESIS_AND_INTERCONVERSION_TRANSAMINATION
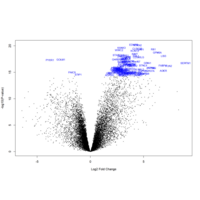
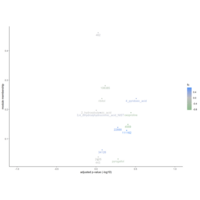
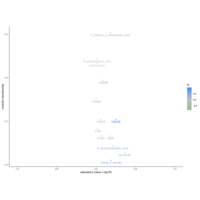
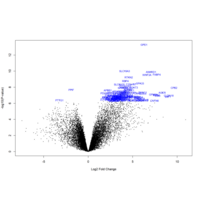
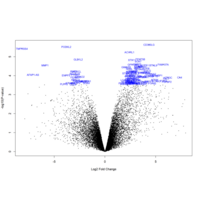
Volcano Plot of LUAD Vs Control
Volcano Plot of differentially-expressed genes of mRNA Seq data of Lung Adenocarcinoma "LUAD" (primary solid tumor samples) Vs Normal solid lung tissue samples "Control".
MD Plot of LUAD Vs Control
MD Plot of differentially-expressed genes of mRNA Seq data of Lung Adenocarcinoma "LUAD" (primary solid tumor samples) Vs Normal solid lung tissue samples "Control".