
BlackburnStat
Alexander Blackburn
Recently Published


HTML
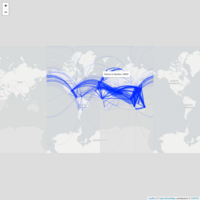
Source: rail_go_intcmgn Eurostat
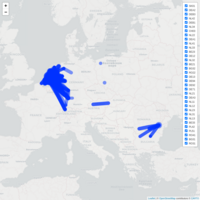
E-IWW Inland Waterway Tonnage map, 2020
Activity data: Eurostat atygofl table
IWW Network: UNECE Blue Book Database
E-Rail map, 2015
UNECE E-Rail Census, mapped onto European TEN-T network
IWW tonnage change 2018-2020
Source: Eurostat

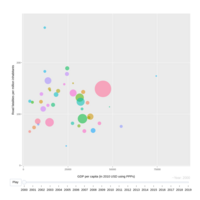
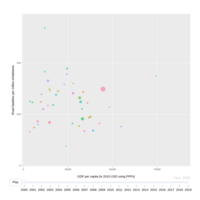
UNECE Road fatalities per capita versus GDP per capita
All data from w3.unece.org.
Created in R using the pxweb and plotly packages
Code available at https://github.com/blackburnstat/RoadfatalitiesperGDP
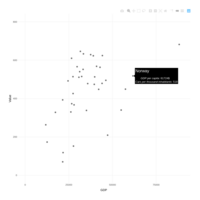
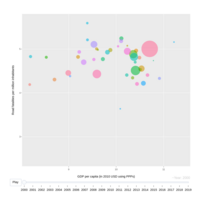
GDp per capita versus cars per inhabitants
From the UNECE statistics database
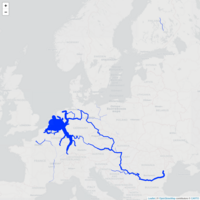
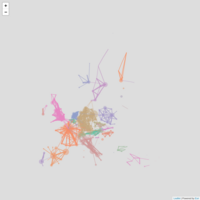
Inland Water transport by type of good
All flows above 250,000 tonnes a year. 2018 data. From Eurostat iww_go_atygofl dataset.
Inland Water transport by type of good
All flows above 500,000 tonnes a year, from Eurostat iww_go_atygofl dataset, 2018 data.
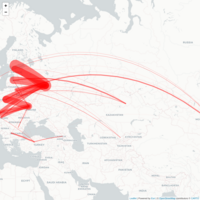
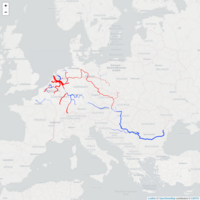
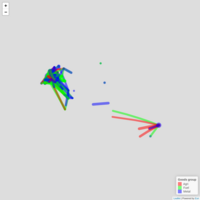
Rail freight map, 2015
Rail freight between NUTS2 regions, based on Eurostat tran_r_rago dataset for 2015.
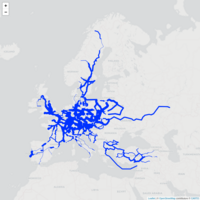
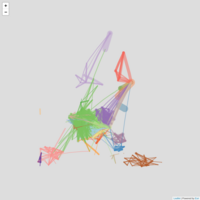
International Rail passengers, 2015 by NUTS2 region
From the Eurostat dataset trans_r_rapa. Only volumes greater than 50,000 passengers pa.
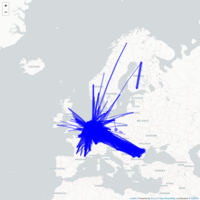
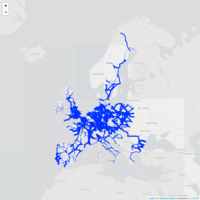
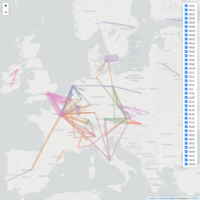
European Rail Passenger flows, 2015
Data by Nuts2 region, from Eurostat "trans_r_rapa" dataset. Mapped using Leaflet in R.
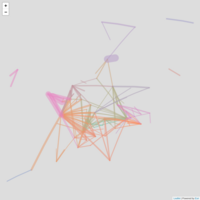
2015 international rail passenger flows by NUTS2 Region.
Data come from the Eurostat tran_r_rapa table. Only includes routes with >100,000 passengers a year.
R script available at https://github.com/blackburnstat/Rail_passenger_flows
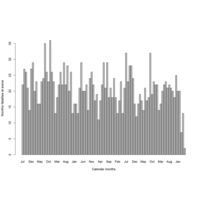
Monthly road fatalities in NYC, recorded by NYPD
Source: https://data.cityofnewyork.us/Public-Safety/Motor-Vehicle-Collisions-Crashes/h9gi-nx95
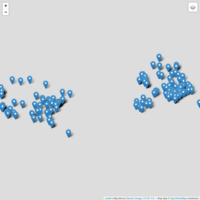
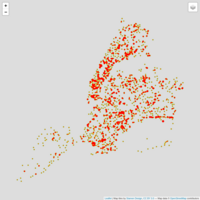
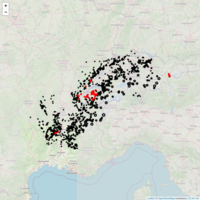
Heat map of NYC road fatalities since 2012
Data come from https://data.cityofnewyork.us/Public-Safety/Motor-Vehicle-Collisions-Crashes/h9gi-nx95. Data manipulated in R and mapped using addWebGLHeatmap function of the leaflet.extras package.