
Chaosbus
William Wright
Recently Published

Final Project
This is my Final Project for My Election Analytics Class

TN County Presidential Voting Shifts Demo
This is an interactable vote tracker Demo that shows the results of the 2020 and 2024 Presidential Election respectively, showing the growth and loss points in counties all across Tennessee for Democrats and Republicans respectively.

Election Night Map 2024
This is a representation of the 2024 election Presidential Election, specifically tracking the electoral college polls as they are called state by state.

Election Tracker Demo
This is a demo of the early voting election tracking in Rutherford county for the 2024 election cycle.

Election Early Voting Map Demo
This is an interactable map that shows early voting locations for the 2024 presidential Election.

HouseElectionAnalytics
This helps to represent key areas that are Democratic and Republican holdouts that are expected to flip in the 2024 House of Representatives Election.

Election Tracker Demo
This election tracker demo helps to show a hypothetical situation of the 2024 presidential election cycle where it shows the possible amount of votes that could be won in the 2024 Election, specifically with the 5 states that are most likely to vote for Kamala Harris and Donald Trump respectively.

Election Analysis Demo
This is a small representation of the 2020 electoral college voting process, with there being a visual representation of who voted for either Biden or Trump, and a note of abstention on representatives who haven't voted for either candidate.

Election Analysis Demo
This election analytics demo helps to show voting districts during a 2022 Gubernatorial Race, showing where there were outliers in a race where Republican candidate Bill Lee was favored over Democrat challenger Jason Martin in most districts, but there was a notable outlier in college campuses like Middle Tennessee State University.
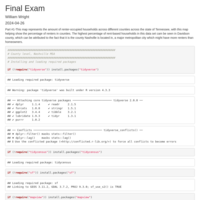
Final Exam
This is three datasets that are representative of different methods I learned in Dr. Blake's Data Skills for Media Professional's class. This includes mapping data, statistical analysis, and term analysis.
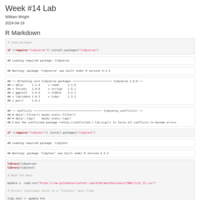
Week #14 Lab
This R code helps to determine term frequency analysis in a data set having to do with bills that have recently been passed in the Tennessee General Assembly.

Week #13 Lab
This code helps to represent outliers whenever representing overall family income whenever being considerate of whether or not they've graduated college, with the data proving that people on average make more money if they have a college degree.

Week #12 Lab
This is a small assessment of temperature dorm halls and a small auditing of whether or not the average temperature is accurately represented in the data.

Week 11 Lab
This R code shows comparing average response times.


Week #10 Lab
This set of R code helps to determine how many households have specific types of heating in the Nashville area, specifically who uses gas heating and who uses electric.


Midterm
This is my midterm and my responses to the questions posed with the midterm. I mentioned the head code and it's accompaniment with my code in my response, but not all of them.


Week 4 Lab (Clarksville V. Murfreesboro Crime Statistics)
A small detailing of crime statistics from the Clarksville and Murfreesboro area.

