DavidHawkins
David Hawkins
Recently Published

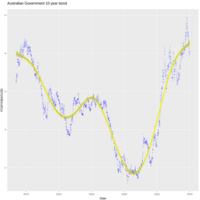
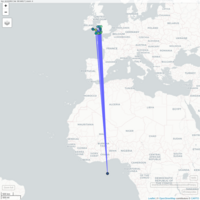
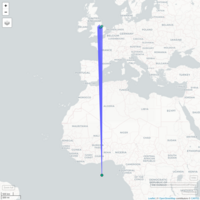
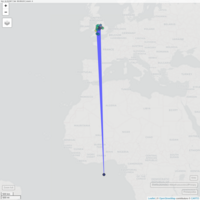
INTFR flows June, July 2026
Contains BSC information licensed under the BSC Open Data Licence.

London Property Price Trends
Nominal prices over years
Contains HM Land Registry data © Crown copyright and database right 2021. This data is licensed under the Open Government Licence v3.0

London Property Price Trends
Contains HM Land Registry data © Crown copyright and database right 2021. This data is licensed under the Open Government Licence v3.0.


VB property
Contains HM Land Registry data © Crown copyright and database right 2021. This data is licensed under the Open Government Licence v3.0.

CV34 Flat Price Trends
"Contains HM Land Registry data © Crown copyright and database right 2021. This data is licensed under the Open Government Licence v3.0."

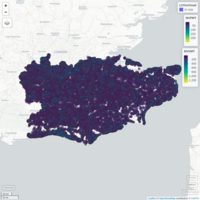
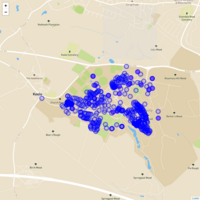
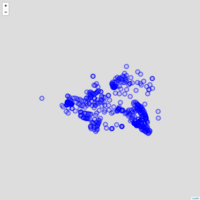
Crime data (2023-2025)
Open data from data.police.uk/data/
LSOAs: Kensington, Kingston-o-T, Wandsworth, Merton

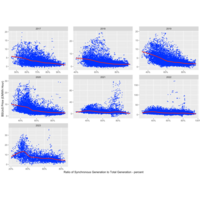
NESO errors vs Asynchronous Generation
Public domain data

Land Registry data
Contains HM Land Registry data © Crown copyright and database right 2021. This data is licensed under the Open Government Licence v3.0.

London property
Contains HM Land Registry data © Crown copyright and database right 2021. This data is licensed under the Open Government Licence v3.0.

London Property Price Trends
author: "Contains HM Land Registry data © Crown copyright and database right 2021. This data is licensed under the Open Government Licence v3.0."


London Property Transactions
Contains HM Land Registry data © Crown copyright and database right 2021. This data is licensed under the Open Government Licence v3.0.


London Price Trends
Contains HM Land Registry data © Crown copyright and database right 2021. This data is licensed under the Open Government Licence v3.0"

London Property Transactions (at Jan 2025 values)
Contains HM Land Registry data © Crown copyright and database right 2021. This data is licensed under the Open Government Licence v3.0.

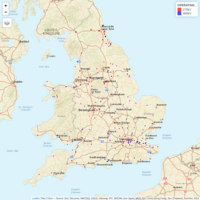
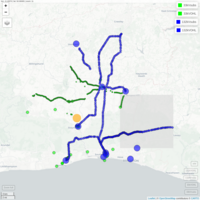
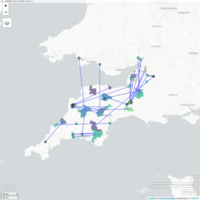
NGET cables and substations
NGET open data
https://www.nationalgrid.com/electricity-transmission/network-and-infrastructure/network-route-maps

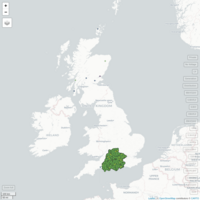
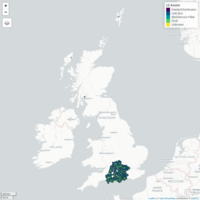
CV37 Median Price Trends
Open data ℅ Land Registry

CV37 Price Trends
Open data ℅ Land Registry


Crystal Palace Land Registry
Open data - properties £350k - £750k
SE19, SE20, SE21

Spain Shutdown - system frequencies in Spain and Latvia
Data: Thanks to ZHAW School of Engineering

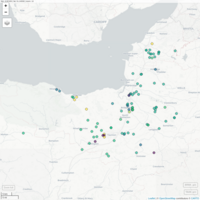
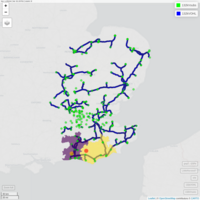
Bio-gas generation map
Data courtesy of
https://www.biogas-info.co.uk

NESO Gas Annual Output Duration Curves
Public Domain Data

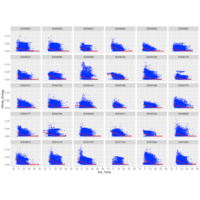
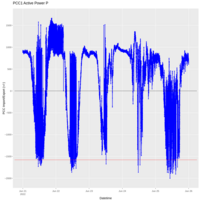
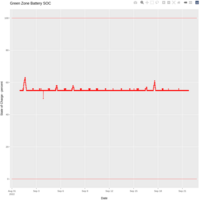
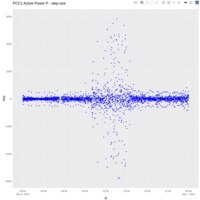
NGED LV Load Monitor Data (7.5M samples)
Public domain via:
https://connecteddata.nationalgrid.co.uk/dataset/lv-load-monitor-data

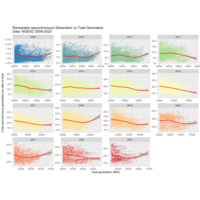
Synchronous vs Total Generation 2009 - 2025
Public domain data via NESO

EPICA data
Source: https://doi.pangaea.de/10.1594/PANGAEA.683655


Spectral Analysis
NESO public domain data


NESO Operating limit exceedences
Public domain data ℅ NESO


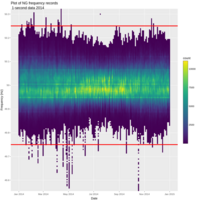
NESO 1-sec frequency 'density' 2014 - 2024
X-limits at 49.75 - 50.25Hz

NESO 1-sec frequency 'density' 2014 - 2024
Kernel Density Estimate (KDE). A small normal density curve is centered at every datapoint and then the densities are summed for all datapoints in a group. This is then normalized to integrate to 1 to generate the KDE


NESO operating limit exceedences
Seconds / month when outside 49.8Hz - 50.2Hz

NESO 1-sec frequency 'density' 2014 - 2024
Kernel Density Estimate (KDE). You can interpret this as a continuous histogram. Briefly and by default, a small normal density curve is centered at every datapoint and then the densities are summed for all datapoints in a group. This is then normalized to integrate to 1 to generate the KDE

NESO 1-sec Histograms
Public domain data


GB Gen. Tech vs Total Demand
NESO public domain half-hour data

Bramley / Basingstoke
SPED cables - open data

Bramley Grid
Public domain data


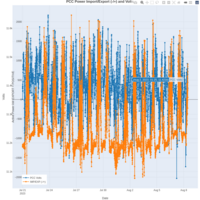
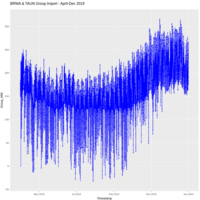
Import / Interconnector Contribution vs GB (half-hour) Demand
Public domain data courtesy of NGESO / NESO


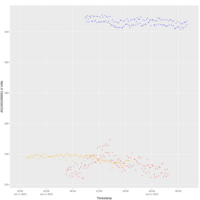
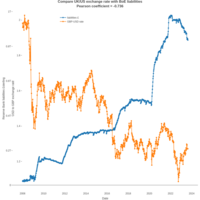
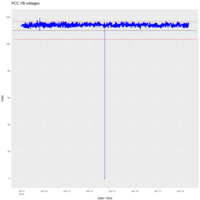
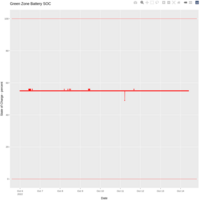
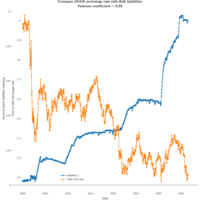
BSUoS per day
Vertical line = Russia invades Ukraine

BSUoS per day
Vertical black line = Russia invades Ukraine


BRAG
Public domain data


Ynysybwl 11kV UG assets
Public domain data source: NGED

YNYSYBWL 11kV UG assets
NB: Public domain data

NGRID
Public domain data

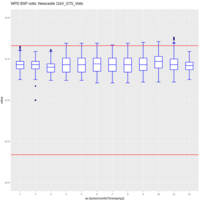
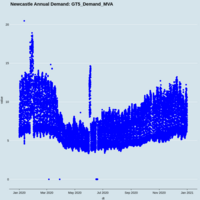
WBUR public domain data
3x SGTs MVA demands

PinPoint site visit
NGED public domain data

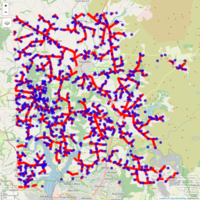
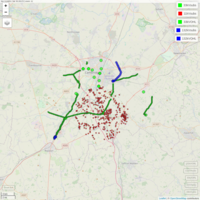
Sample map
11kV cables and substations from open data
NGESO data
BSUoS vs Percentage Synch Generation
SWEST site locations
NB: other sites include NULL entries at LAT/LONG
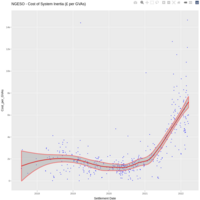
NGESO Inertia Cost
NGESO open data
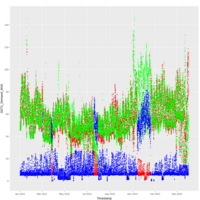
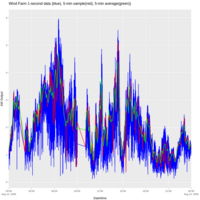
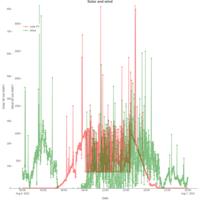
Wind variability
1-second data
Summarised into 5-min samples
and into 5-min averages

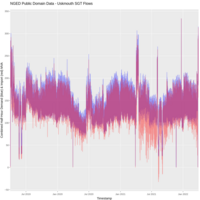
Uskmouth SGT flows
Supported by NGED Open Data
Source: https://connecteddata.nationalgrid.co.uk/dataset/super-grid-transformer-flows-south-wales
Creator:National Grid Electricity Distribution
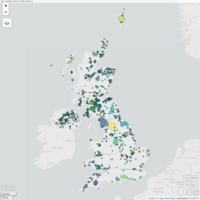
Onshore Wind Farms, UK National Parks
National Parks in E&W plus Scottish National Nature Reserves


BRWA-TAUN
Generation in NGED capacity register (Feb 2023)
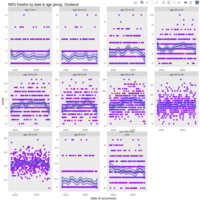
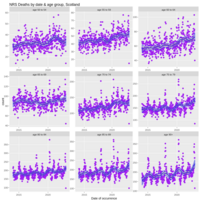

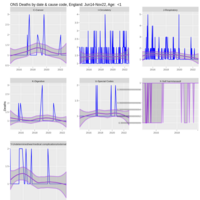
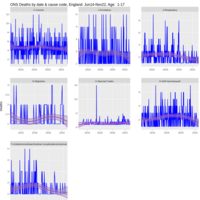
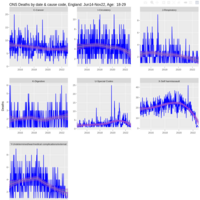
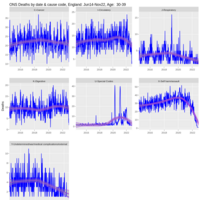
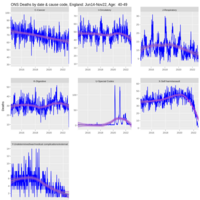
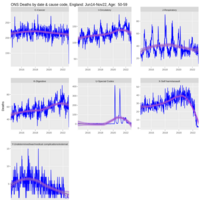
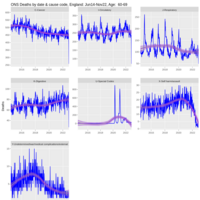
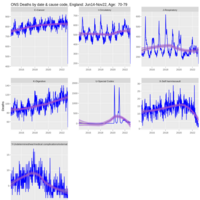
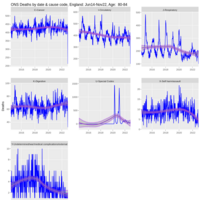
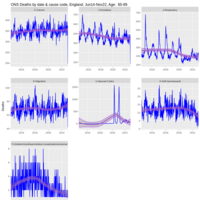
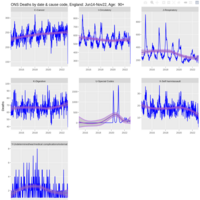
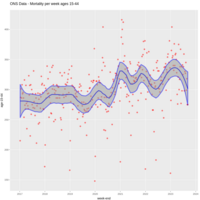
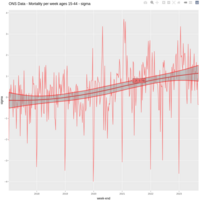
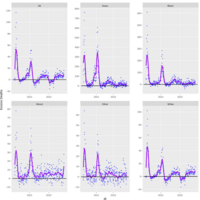
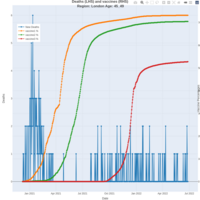
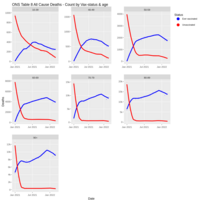
ONS FOI data summary
Data points = sum of all causes each week
Blue line = trend line (best fit using Loess smoothing)
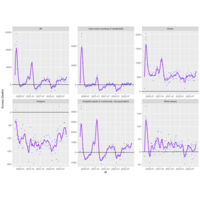
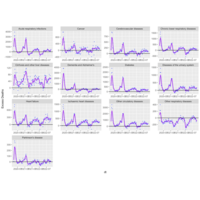
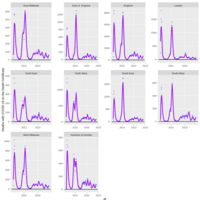
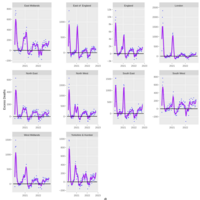
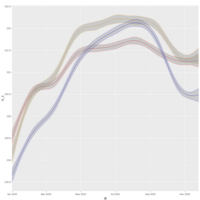
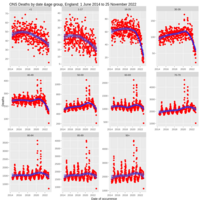
OHID excess deaths by region
Tighter curve fitting...
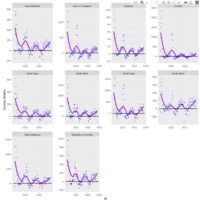
Excess Deaths by region
Source: Office for Health Improvement and Disparities, 3 Nov 2022
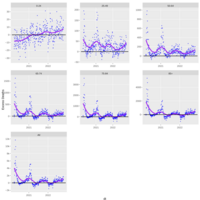
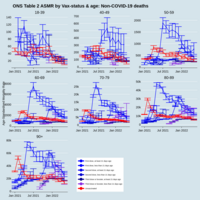
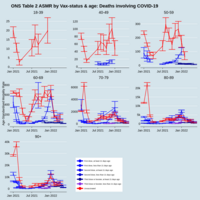
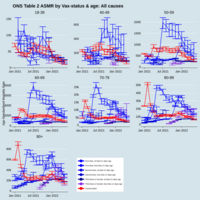
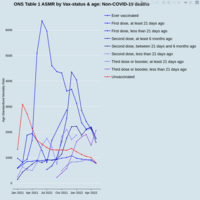
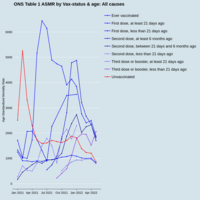
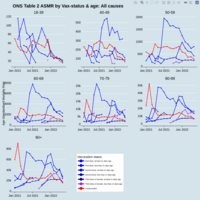
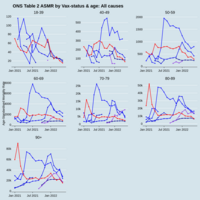
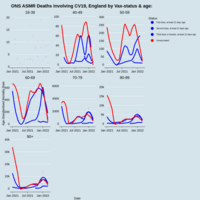
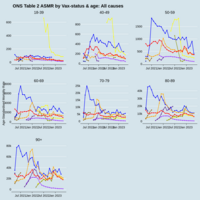
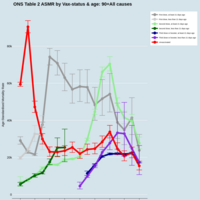
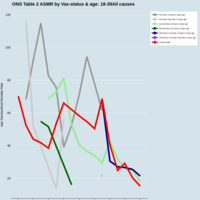
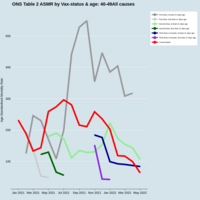
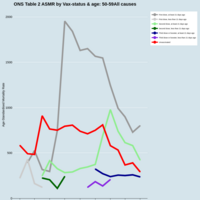
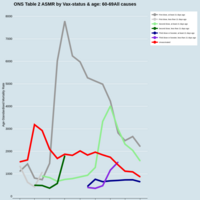
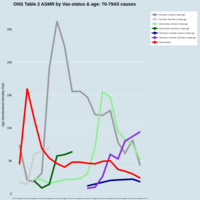
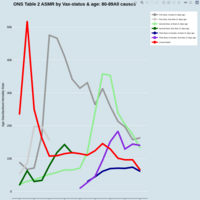
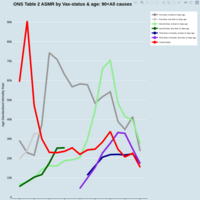
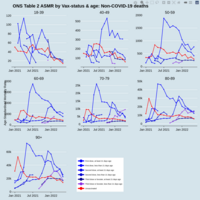
ONS ASMR by age and vaccine status
Source:
https://www.ons.gov.uk/peoplepopulationandcommunity/birthsdeathsandmarriages/deaths/bulletins/deathsinvolvingcovid19byvaccinationstatusengland/deathsoccurringbetween1january2021and31march2022
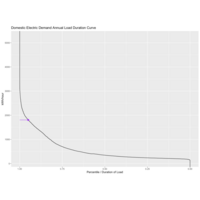
Domestic Electric Load Duration Curve
ecdf of annual electricity demand - 95% of peak ~= after diversity maximum demand for a cluster of dwellings
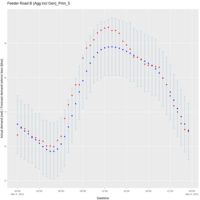
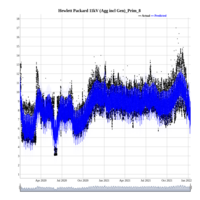
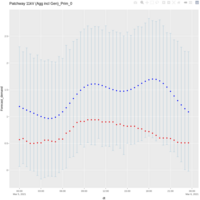
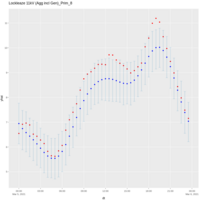
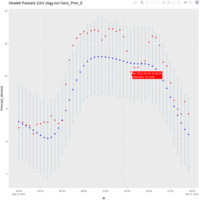
Hewlett Packard 11kV_Prim_8 -- all data w/forecast (see 5/mar/21)
Missing data is at 5-Mar-2021
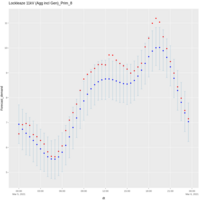
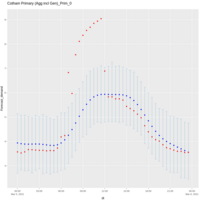
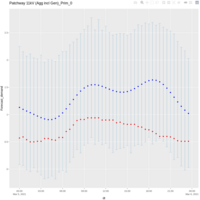
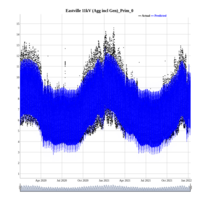
Cotham Primary Prim_0 some missing measurements w/forecast data
Missing data is at 5-Mar-2021