
DocOfi
Edmund Julian L Ofilada
Recently Published

Curriculum Vitae
A brief presentation of my projects in data science

My Research Projects
A brief description of Project Oral Health for Diabetes

My Courses in Coursera
These are the courses i enrolled in Coursera

My Course Project in the Reproducible Templates for Analysis and Dissemination Course
This document is submitted for the purpose of fulfilling the requirement for the course Reproducible Templates for Analysis and Dissemination.
7.1 M Earthquake and Typhoon Haiyan in Bohol, Philippines
Within a span of three weeks, the Philippines was hit by two natural calamities that resulted in loss of lives and destruction of property. It also probably cost one man’s ambition of the presidency and catapulted another from obscurity to prominence.
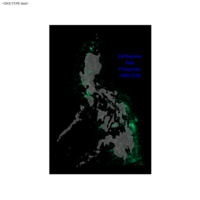
Earthquake Map of the Philippines 1980-2018
A plot of the earthquakes with magnitude greater than or equal to 4.0 M or greater between the period of 1980-2018.
Leyte casualties due to Typhoon Haiyan
The town of Tacloban in the province of Leyte suffered the most number of casualties with 5,356 deaths. About half of the death were unidentified.
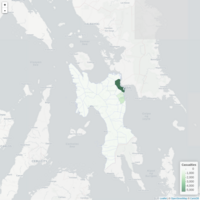
Bohol Earthquake 2013 - Epicenter
Map showing the location of the epicenter of the 7.1 M earthquake in Bohol, Philippines 2013.
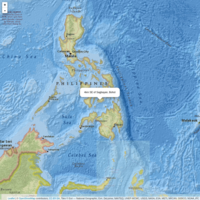
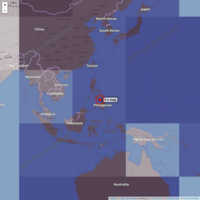
Bohol Earthquake 2013 - Visayas Map
Map showing the location of Bohol in the Visayas
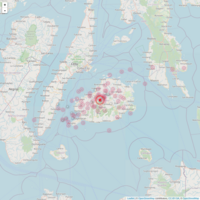
Bohol Earthquake 2013
The map shows the location of the 7.1M earthquake that hit Bohol in 2013 and the aftershocks that followed in the next 2 days
Mapping My Run
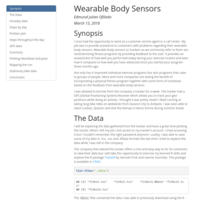
I once had the opportunity to work as a customer service agent in a call center. My job was to provide assistance to customers with problems regarding their wearable body sensors. Wearable body sensors or trackers as we commonly refer to them are revolutionizing fitness programs by providing feedback to the user. It provides an asseesment of how well you performed today during your exercise routine and even how it compares to how well you have advanced since you started your program three months ago.
Not only has it improved individual exercise programs but also programs that cater to groups of people. More and more companies are seeing the benefit of incorporating a physical fitness program together with some form of incentives based on the feedback from wearable body sensors.
I was allowed to borrow from the company a tracker for a week. The tracker had a GPS (Global Positioning System) Receiver which allows you to track your geo-positions while doing an activity. I thought it was pretty neat!!! I liked running or taking long bike rides on weekends from Quezon City to Antipolo. I was even able to reach Lucban, Quezon and visit the Kamay ni Hesus Shrine during summer break.
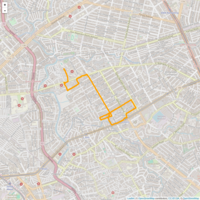
Morning Run
Usiing wearable body sensor,, I tracked my route around New Manila during a running session..
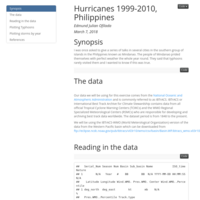
Hurricanes 2000-20010, Philippines
I was once asked to give a series of talks in several cities in the southern group of islands in the Philippines known as Mindanao. The people of Mindanao prided themselves with perfect weather the whole year round. They said that typhoons rarely visited them and I wanted to know if this was true.
7.1 M Earthquake and Typhoon Haiyan in Bohol, Philippines
In 2013, Within a span of three weeks, the Philippines was hit by two natural calamities that resulted in loss of lives and destruction of property. It also probably cost one man’s ambition of the presidency and catapulted another from obscurity to prominence.

HTML
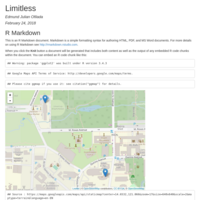
Limitless @ UP Diliman
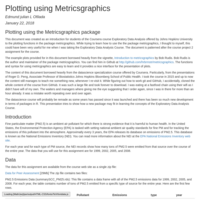
Plotting using Metricsgraphics
This document was created as an introduction for students of the Coursera course Exploratory Data Analysis offered by Johns Hopkins University to the plotting functions in the package metricgraphics. We will be using data on Fine particulate matter (PM2.5) from the Environmental Protection Agency (EPA).
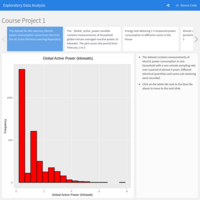
Exploratory Data Analysis using Flexdashboard
This presentation uses data from the course Exploratory Data Analysis from Coursera. The plots in the presentation were created using packages from ggplot2, and dysgraph. The goal of this presentation is to offer students in this class a quick comparison between ggplot, dygraphs and what base R which the students used in class.

The FARSread package
Illustrating the fars_map_state function of the FARSread package
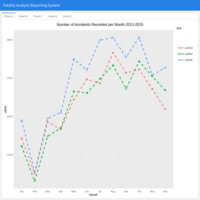
Fatality Analysis Reporting System
Package FARSread
Package FARSread was designed to make it easy for R users to summarize and visualize the Fatality Analysis Reporting System or FARS data from the National Highway Traffic Safety Administration NHTSA. This document hopes to familiarize the reader with the fars_read function from the package FARSread and the variables contained in a FARS data file. https://github.com/DocOfi/FARSread-Package
Predicting House Prices
Our task is to develop a model to predict the selling price of a given home in Ames, Iowa. We hope to use this information to help assess whether the asking price of a house is higher or lower than the true value of the house. If the home is undervalued, it may be a good investment for the firm.
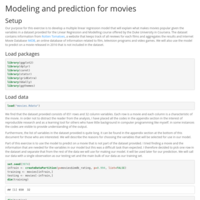
Modeling and Prediction for Movies
Our purpose for this exercise is to develop a multiple linear regression model that will explain what makes movies popular given the variables in a dataset provided for the Linear Regression and Modelling course offered by the Duke University in Coursera.
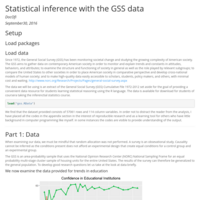
Education in the GSS Data.
Education has been touted as an avenue to escape poverty. It has been referred to as an inheritance that parents can bequeath to their children which cannot be stolen or reduced by decay. However, when access to good education is restricted by financial capacity, it becomes yet another structure that promotes oppression and inequality in society.
This is why the efforts of those behind Coursera is praiseworthy because of the almost quixotic ideals that it fosters and the unbelievable courage it has for taking the challenge of reversing the trend in education not only in the United States but in the whole world.
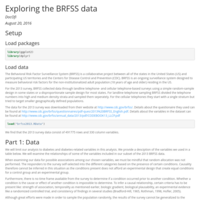
Diabetes Variables i the BRFSS 2013 Survey
We explored the various diabetes related variables in the BRFSS data, particularly Body Mass Index and its possible association with stroke and heart attack. We also examined the association between age and eye problems among diabetics
Predicting The Next Word
A brief description of an App designed to predict the next word from a corpus sourced from the news.
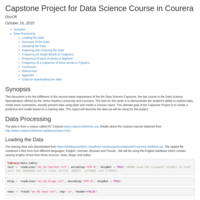
Capstone Project for Data Science Course in Courera
This document is for the fulfillment of the second week requirement of the the Data Science Capstone, the last course in the Data Science Specialization offered by the Johns Hopkins University and Coursera. The task for this week is to demonstrate the student’s ability to explore data, create basic summaries, visually present data using plots and create a concise report. The ultimate goal of the Capstone Project is to create a predictive text model based on a training data. This report will describe the data we will be using for this project.
Comparing Algorithms - Guide to the App
This presentation is a guide for the use of an App that you can access at https://docofi.shinyapps.io/ShinyApp10/. The App facilitates comparison of the performance of different algorithms found in the caret package by comparing the datapoints the model failed to correctly classify. The full article can be found at http://www.rpubs.com/DocOfi/170079
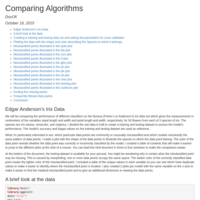
Comparing Algorithms
We will be comparing the performance of different classifiers on the famous (Fisher's or Anderson's) iris data set which gives the measurements in centimeters of the variables sepal length and width and petal length and width, respectively, for 50 flowers from each of 3 species of iris. The species are Iris setosa, versicolor, and virginica. I divided the raw data in half to create a training and testing dataset to assess the model's performance. The model's accuracy and kappa values on the training and testing dataset are used as reference.

Oral Health of Children with type 1Ddiabetes
Presenting data from Project Oral Health for Juvenile Diabetics
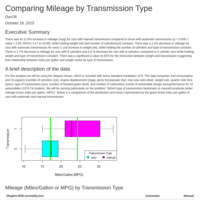
Comparing Mileage by Transmission Type
There was an 11.6% increase in mileage (mpg) for cars with manual transmission compared to those with automatic transmission (p = 0.009; t value = 2.83, 95%CI 3.17 to 19.98), while holding weight (wt) and number of cylinders(cyl) constant. There was a 2.4% decrease in mileage for cars with automatic transmission for every 1 unit increase in weight (wt), while holding the number of cylinders and type of transmission constant. There is 2.7% decrease in mileage for cars with 6 cylinders and 4.8 % decrease for cars with 8 cylinders compared to 4 cylinder cars while holding weight and type of transmission constant. There was a significant p value (0.007) for the interaction between weight and transmission suggesting that relationship between miles per gallon and weight varies by type of transmission

Predicting Movement
The predominant approach to preventing injuries currently is to provide athletes with a professional trainer who provides real time feedback while observing the execution of certain exercises. The objective of this work is to determine whether it will be possible to classify errors during the execution of movement based on data obtained from motion traces recorded using on-body sensors. We used regression as our tool to create predictive models on the HAR weight lifting exercises dataset. We classified errors and correct execution of lifting barbells with high accuracy, sensitivity and specificity.
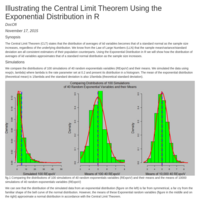
Illustrating the Central Limit Theorem Using the Exponential Distribution in R
The Central Limit Theorem (CLT) states that the distribution of averages of iid variables becomes that of a standard normal as the sample size increases, regardless of the underlying distribution. We know from the Law of Large Numbers (LLN) that the sample mean/variance/standard deviation are all consistent estimators of their population counterparts. Using the Exponential Distribution in R we will show how the distribution of averages of iid variables approximates that of a standard normal distribution as the sample size increases

An experiment to determine the effects of different types and concentrations of ascorbic acid on the growth of odontoblast cells in guinea pigs
There are no significant differences in the mean odontoblast cell length between the group of guinea pigs receiving orange juice and vitamin c in general and when the dose is 2 mg/day. There are significant differences in the means between the groups when the dose is 0.5 (p = 0.01) (t.test = 3.17, 95% CI 1.72 to 8.78) and 1.0 mg/day (p = 0) (t.test = 4.03, 95% CI 2.8 to 9.06).
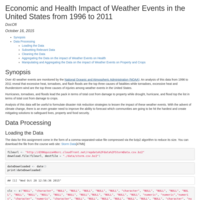
Economic and Health Impact of Weather Events in the United States from 1996 to 2011
Submitted as a requirement to Coursera's Reproducible Research

Reproducible Research Peer Assessment 1
Submitted as a requirement to Coursera's Reproducible Research course