
DragonflyStats
Kevin O'Brien
Recently Published

New R Community Infrastructure
Development of a new R community infrastructure to replace meetup and twitter

Building a Reproducible Analytical Pipeline for IOM DTM Data in R
Outline of Proposed Presentation for Rome R User Group & IOM Staff
Presentation Title: From Field to Forecast: Building a Reproducible Analytical Pipeline for IOM DTM Data in R
This 45-minute presentation is structured to balance high-level humanitarian context with technical R implementation. It is designed to keep both “Domain Experts” and “R Developers” engaged by alternating between Why (the mission) and How (the code).

Accessing The Displacement Tracking Matrix (DTM) API using R
Accessing The Displacement Tracking Matrix (DTM) API using R

What is the Displacement Tracking Matrix (DTM)
Description of the International Organization of Migrations's Displacement Tracking Matrix

The Everybody Pays Principle at Open Source Conferences
The "everyone pays" principle at tech conferences is a philosophy that encourages equal financial contribution from all attendees, including speakers, organizers, and volunteers. The idea is to foster a more inclusive, transparent, and community-driven environment by removing special treatment or hidden hierarchies.

Social Media Tips for Open Source Communities
Tips to optimize outreach using social media tools

London R In the 2010s
Recalling the Heyday of the London R Community

Using AI in a Day-To-Day Workflow
How I incorporate AI tools into my daily workflow

AI And The Accelleraton Of Workflows
How to get the best from the volume of AI content

AI And The Expert-Beginner Problem
How AI is exacerbating the ""Expert-Beginner Problem"". AI empowers beginners but risks deepening gaps by masking weak understanding with polished output.

The Golden Age of the Data Scientist
How AI will Shape The Profession

Using Voice-to-Text and AI Tools for Coding & Documentation
Discussion of using Voice To Text Tools for Codng

Predictive Modelling (Week 07)
Prediction modeling is a vital aspect of data science that leverages machine learning techniques to make accurate predictions based on historical data. By following systematic steps, such as data splitting, variable selection, model selection, and evaluating model accuracy, data scientists can build robust predictive models. The key to successful prediction modeling lies in having high-quality data, choosing simple and effective models, and continuously validating and optimizing the model's performance.

Predicting Annual Air Pollution (Case Study)
The study seeks to provide insights into the distribution and impact of air pollution across different socioeconomic regions in the United States. It aims to highlight potential disparities and inform policy decisions to improve air quality and public health outcomes.

Tuning Models with tune_grid in {tidymodels}
This tutorial provides a basic introduction to `tune_grid`. Explore the tidymodels documentation for more advanced features and examples, such as custom tuning grids, parallel processing, and more complex model tuning scenarios.

Hypothesis Testing (Week 06 Overvew)
Overview of the Week 06 of the "Modelllng Data" course in the Coursera Tidyverse Specialization

The Infer R Package
Demonstration of the {Infer} R Package.

Correlation Analysis with R
Examination of how to do Correlation Analysis with R

Survival Analysis - The Orange Telecom Churn Dataset
The **Orange Telecom's Churn Dataset** is designed to help in developing predictive models to identify customers who are likely to cancel their subscriptions.

Survival Analysis - The Prostate Screening Dataset
The **Prostate Cancer Dataset** is often used in medical research to study prostate cancer screening, diagnosis, and treatment outcomes. One well-known dataset is from the **Prostate, Lung, Colorectal, and Ovarian (PLCO) Cancer Screening Trial**.

Telco Dataset: Applying Kaplan Meier
Here we will apply Kaplan-Meier (KM) estimators and smoothed hazard functions to the telco data set.

Introduction to Survival Analysis
Overview of the Survival Analysis Series

Probability Distributions
Probability Distributions

The Pareto Distribution
The Pareto distribution, specifically the Pareto Type I distribution, is a continuous probability distribution used to model various types of data. Here, we focus on the distribution with the parameter \( x_m \)

Weibull Probability Distribution
The Weibull distribution is widely used for life data analysis. Among its variations, the two-parameter Weibull distribution is the most common, though the three-parameter and one-parameter versions are also utilized for more detailed analysis.

Formulas for Bivariate Analysis
This sheet deals specifically with formulas for linear models and related bivariate analyses. Material related to categorical data will be published elsewhere.

Control Chart Factors
Control Chart Factors, also known as control chart constants, are critical components used in the creation and interpretation of control charts in statistical process control (SPC). These factors help in calculating control limits and other chart parameters, ensuring that the process variability is accurately monitored.

Testing Proportions With R
The prop.test function in R is used to perform a test of proportions. It allows you to test whether the proportions in one or more groups are equal to specified values or whether the proportions in two or more groups are equal. This function is often used in hypothesis testing to compare proportions in different samples.

Chi Square Test for Independence
Critical Values for Chi Square Test

The patchwork R package
Combining R graphics into a single composite plot.

Survival Analysis - Introduction to Survival Models
Statistical Modelling with R - Introduction to Survival Models

Survival Analysis - Cox Regression Modelling
Survival Analysis - Cox Regression Modelling

Normal Distribution - Worked Example
Introduction to Probability Distributions - Worked Examples of the Normal Distribution

The Poisson Distribution
Introduction to Probability - The Poisson Distribution

ETL and Data Pipelines - Coursera Data Engineering Specialization
ETL and Data Pipelines - Coursera Data Engineering Specialization

Data Warehousing and BI Analytics
Data Warehousing and BI Analytics

Chi Square Test for Independence
Chi Square Test for Independence

Vectors and Vector Operations
Vectors and Vector Operations

The Binomial Distribution
The Binomial Distribution

The Exponential Distribution
The Exponential Distribution

Normal Distribution
Introduction to Statistics and Probability - The Normal Distribution

The Geometric Distribution
The Geometric Distribution

Linux Course Notes
Linux Course Notes

Statistics - Bivariate Data Analysis
Bivariate Data Analysis

The {MASS} R Package
The {MASS} R Package

Modelling Count Variables with R
Modelling Count Variables with R

R In Forestry - Statistical Methods
Statistical Methods for Forestry

Introduction to tidymodels
Introduction to tidymodels - draft of a workshop on tidymodels

Working with Databases for R Users
Draft Material for a Workshop on Working with Databases for R Users

duckdb for R users
Draft Material for a presentation on {duckdb} for R Users

The {brms} R package
The {brms} R package

R In Forestry
Material for a talk on the use of R in commercial forestry

ggdist example with Palmer Penguins
Worked example of ggdist

The {terra} R package
draft material for an introductory workshop on GIS with R in 2025

Docker for R Users
Draft material for introductory workshop on Docker for R Users

The Systolic Blood Pressure data
The Systolic Blood Pressure data, which is commonly used as an exemplar dataset in the clinical analysis of measurement dat. The key feature of this dataset is the simultaneous measurement by three devices on the set of patients.

The {reactable} R package
The reactable package in R allows you to create interactive data tables. It’s a powerful tool for building customizable tables in web applications and R Shiny dashboards. You can use the reactable() function to create tables from data frame

tidypolars R package
Draft on a talk for the tidypolars R package
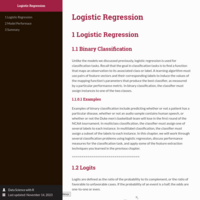
Logistic Regression with R -Part 1
Introduction to Logistic Regression and Implementation of logistic regression models with R

Repeatability
The Importance of Repeatability in Method Comparison Studies, and the Coefficient of Repeatability
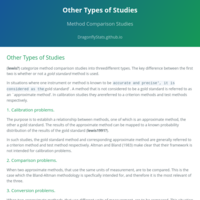
Adjacent Analyses to Method Comparison Studies
Adjacent Analyses to Method Comparison Studies

Bland Altman Plot
Creating a Bland-Altman Plot from First Principles with R
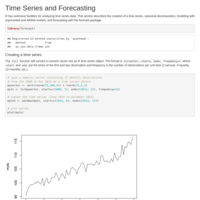
Time Series With R - Part 1
Introduction to Time Series with R
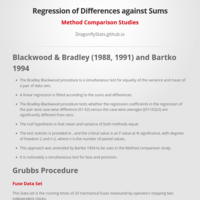
Regression of Pairwise Differences and Sums
Regression of Pairwise Differences and Sums

Bland Altman Plot Ellipse
Proposal of an addition of an ellipse to the Bland-Altman plot

Limits of Agreement on Bland-Altman Plots
Enhancement of Bland-Altman Plots proposed by Bland-Altman 1986

Publication History of Bland-Altman (1986)
"Statistical methods for assessing agreement between two methods of clinical measurement. (Lancet 327, 307–310 (1986)" by Bland, J. M. & Altman, D. G. is one of the most cited papers of all time. This analysis tracks the citation history by since the paper's publication in the Lancet in 1986.

Technology Acceptance Model
Technology Acceptance Model
Working With Numbers
Working with Numbers and Integers

Matthews Correlation Coefficient
Matthews Correlation Coefficient
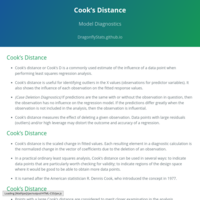
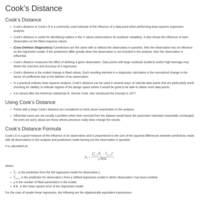
Cook's Distance
Assessing Model Fits with Cook's Distance
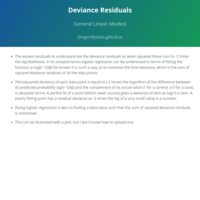
Deviance Residuals
Discussion about Deviance Residuals in GLMs

Air Quality Measurements
Air Quality Measurements
Air Passengers
The Air Passengers Dataset
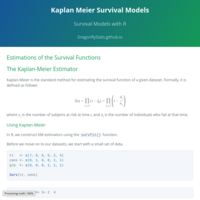
Kaplan Meier Survival Models
Kaplan Meier Survival Models
The cheddar dataset
In a study of cheddar cheese from the LaTrobe Valley of Victoria, Australia, samples of cheese were analyzed for their chemical composition and were subjected to taste tests. Overall taste scores were obtained by combining the scores from several tasters.
Graphical Methods for Method Comparison
Graphical Methods for Method Comparison
K-Means Clustering with R
Introduction to K-Means Clustering with R
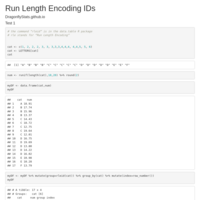
Run Length Encoding IDs with {data.table}
The rleid() function in the {data.table} R package
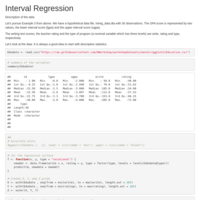
Interval Regression
Demonstration of Interval Regression using a worked example involving education data
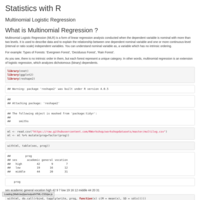
Multinomial Logistic Regression
Multinomial Logistic Regression
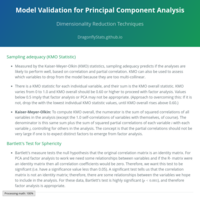
Model Validation for Principal Component Analysis
Model Validation for Principal Component Analysis

Choosing the Number of PCA Components
Choosing the Number of PCA Components
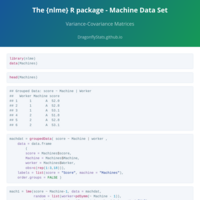
Machine dataset - Variance-Covariance Matrices with {nlme}
Fitting Variance-Covaiance matrices to LME models
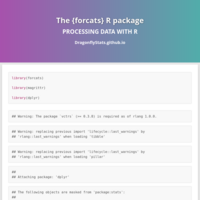
The {forcats} R package
Processing categorical data (factors) with the {forcats} R package
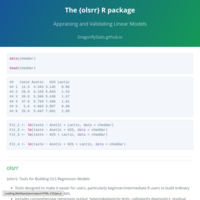
The {olsrr} R package
Deomstration of the {olsrr} R package
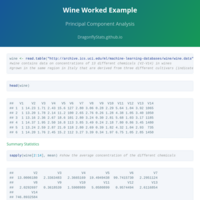
PCA - Wine Example
Demonstration of PCA on the Wine Dataset
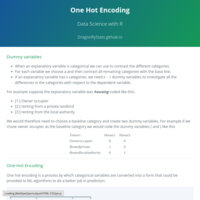
One Hot Encoding
One Hot Encoding
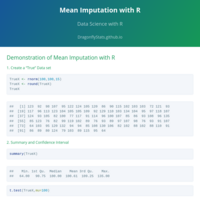
Mean Imputation with R
Demonstration of Mean Imputation for Missing Values using a worked example with R
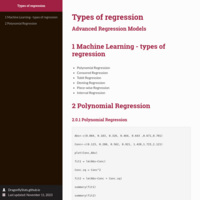
Advanced Regression Models
Extensions of the conventional OLS linear models

Akaike Information Criterion
Using the Akaike Information Criterion (AIC) for appraising linear model
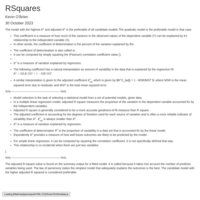
R-Square Measures for Model Appraisal
Definitions of R-Square Measures for Model Appraisal for Linear Models
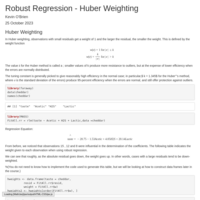
Huber Weighting for Robust Regression
Demonstration of Huber Weighting for Robust Regression

Shapiro-Wilk for Testing Normality
Testing the assumption of a normal disttributed data set.

Assessing Normality
Testing Normality in data to validate the required assumptions for inference procedures
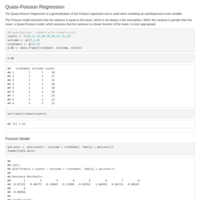
Quasi-Poisson Regression
Quasi-Poisson Regression
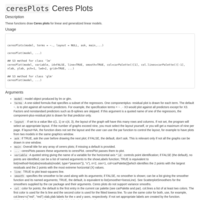
Ceres Plots for Model Diagnostics
Implementation of ceres plots for model diagnostics using the ceresPlots() function in the {car} R pacakge
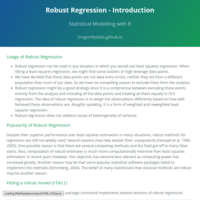
Introduction To Robust Regression
Introduction to Robust Regression
Robust Regression - Stackloss Example
Examining various Psi Operators for Robust Regression using the stackloss data set
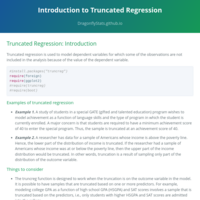
Introduction To Truncated Regression
Introduction to Truncated Regression
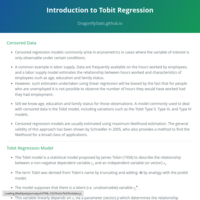
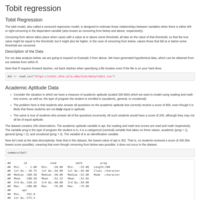
Tobit Regression
Introduction to Tobit Regression
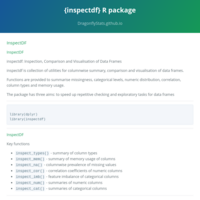
{inspectdf} R Package
inspectdf is collection of utilities for columnwise summary, comparison and visualisation of data frames.
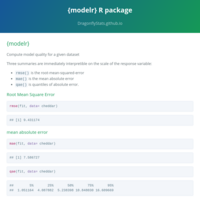
{modelr} R Package
modelr is a package that helps you create elegant pipelines when modelling with the pipe operator in R. It provides functions for partitioning, resampling, model quality metrics, and interactions with models.
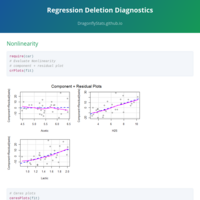
Nonlinearity in Linear Models
Nonlinearity in Linear Models
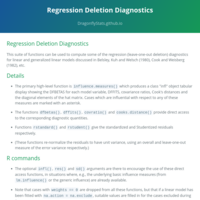
Influence Measures for Linear Models
Influence Measures for Linear Models
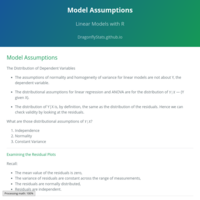
Linear Model Assumptions
Assumptions for Linear Models
Colinearity In Regression Models
Tests for Collinearity In Regression Models
Non Parametric Statistical Procedures with R
Non Parametric Statistical Procedures with R

The Monty Hall Problem
Using R to analyse the Monty Hall Problem
Zero-Inflated Poisson Regression
Zero-Inflated Poisson Regression
Cohen's Kappa
Implementation of Cohen's Kappa using the {vcd} R package
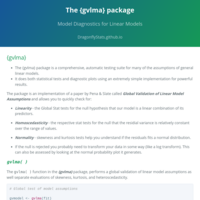
The {gvlma} R package
The {gvlma} package is a comprehensive, automatic testing suite for many of the assumptions of general linear models. It does both statistical tests and diagnostic plots using an extremely simple implementation for powerful results.
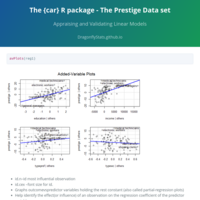
The {car} R package: Prestige Data Set Example
Demonstration of the {car} R package using the Prestige dataset as an example
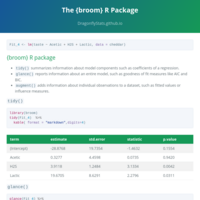
The {broom} R package
The {broom} R package
Bartlett's test for Homogeneity of Variances
Bartlett's test for Homogeneity of Variances
Log Transformation
<Draft> Log Transformation of Data
Inference Procedures with R
Introduction to the main set of Inference Procedures used in R
Influence Measures for LME Models
Influence Measures for LME Models
Model Diagnostics - Definitions
Key definitions for Model Diagnostics
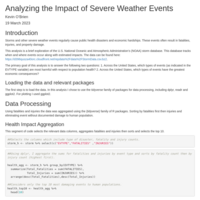
Most Dangerous Severe Weather Events
Storms and other severe weather events regularly cause public health disasters and economic hardships.
These events often result in fatalities, injuries, and property damage.
This analysis is a brief exploration of the U.S. National Oceanic and Atmospheric Administration's (NOAA) storm database.
This database tracks when and where events occur along with estimated impacts.
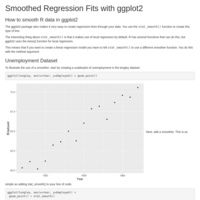
Adding Smoothers to Scatterplots
Adding smoothed regression lines to ggplot scatterplots
Coursera Regression Quiz 4
Coursera Data Science Specialization - Quiz 4 for Regression Module
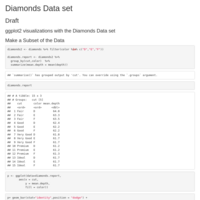
Diamonds Data Set
ggplot2 visualizations with the Diamonds Data set
Ordinal Logistic Regression
Implementing Ordinal Logistic Regression on the Student College Applications data set using the {polr} command from the {MASS} R package
Multinomial logistic regression with R
In statistics, multinomial logistic regression is a classification method that generalizes logistic regression to multiclass problems, i.e. with more than two possible discrete outcomes.
Correlation with R
Analysis of Correlation of two numeric variables with R
Chi-Square Test for Association
Using R to test the association of two categorical variables
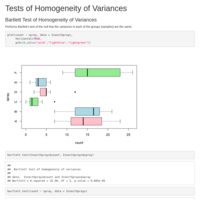
Tests of Homogeneity of Variances
Using the Bartlett Test and Fligner Test to test the assumption of homogeneity of variances, as part of an overall ANOVA procedure.
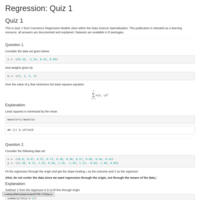
Regression - Quiz 1
Quiz 1 for the Regression module as part of Coursera's Data Science Specialization

Likert Plots with gglikert
"gglikert()" generate a ggplot2 plot for a Likert 5-scale question
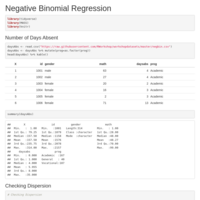
Negative Binomial Regression
Demonstration of Negative Binomial Regression using the "Days Absent" data set
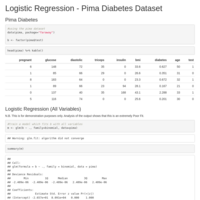
Logistic Regression with the Pima Diabetes Dataset
Logistic Regression with the Pima Diabetes Dataset
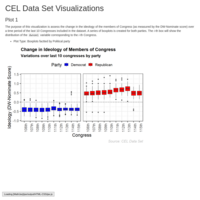
CEL Data Set Visualization
Visualizations for the CEL data set
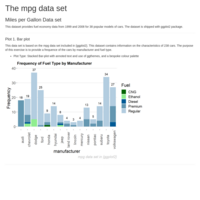
Miles Per Gallon Data Set
Visualizations for the mpg data set in ggplot2
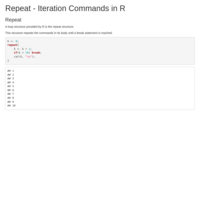
Iteration using "repeat"
using "repeat" for iteration. The loop is broken with a break statement triggered by a logical condition
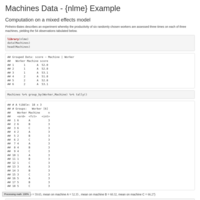
LME models for the Machines Data Set
Demonstration of LME model fitting for the Machines Data Set using the {nlme} R package
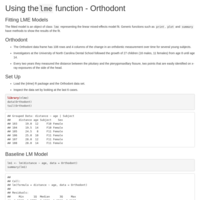
Orthodont Data set ( nlme R Package)
An exploration of the Orthodont data set, using models fitted by the {nlme} R package
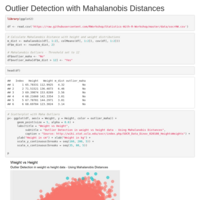
Outlier Detection with Mahalanobis Distances
Outlier Detection with Mahalanobis Distances
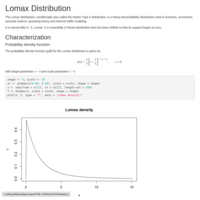
Lomax Distribution
Using R and the {Renext} R pacakge to work with the Lomax Distribution (also known as the Pareto Type 2 Distribution)
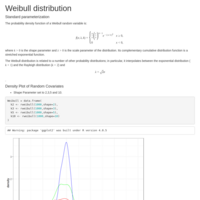
Weibull Distribution
Probability Distributions with R - The Weibull Distribution
System Date and Time
System Date and Time
Wilcoxon Test
Implementation of the Wilcoxon Test using R
Friedman Rank Sum Test
Implementation of the Friedman Test using the Warpbreaks data set
Fast Food Data Visualization - Version 1
Exercise for the Visualizing Data in the Tidyverse module - as part of the Coursera Tidyverse Specialization
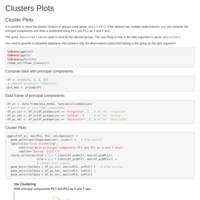
Cluster Plots
Making Cluster plots with "geom_encircle()" from the {ggalt} R pacakge

Highcharter Series Plots
Plotting time series data with the {highcharter} R package
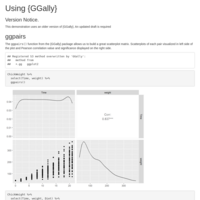
Using {GGally} R Package
Using the ggpairs() and ggscatmat() functions from the {GGally} R package to visualize bivariate data

Conover-Iman Test
The Conover-Iman test is a post hoc test that perform pairwise comparisons using the same rankings used in the Kruskal-Wallis test

Kruskal-Wallis Test with R
How to perform the Kruskal Wallis Test in R
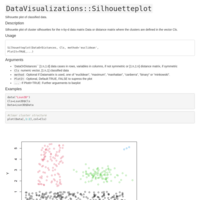
Silhouette Plots
Making Silhouette plots with the {DataVisualization} R package
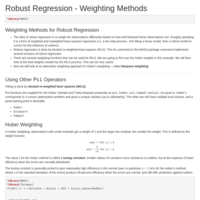
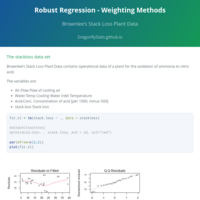
Weighting Methods for Robust Regression
Comparison of Weighting Methods for Robust Regression using R.
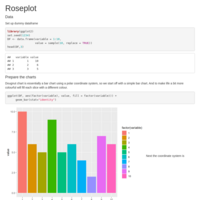
Roseplots
Making roseplots with {ggplot2}
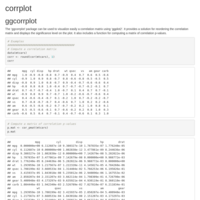
Correlation Plots
Demonstration on how to create Correlation Plots using the ggcorrplot R package.
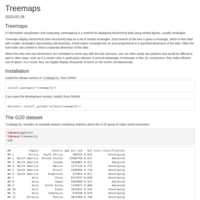
Making treemaps
making treemaps with the treemapify R package

Mahalanobis Distance
The Mahalanobis distance is the distance between a data point and the origin (mean) in a multivariate space, and is often used to identify outliers in multivariate statistical analyses.
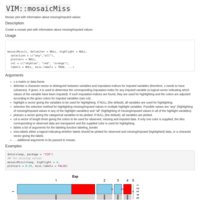
mosaicMiss
Mosaic plot with information about missing/imputed values
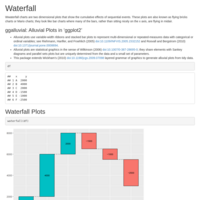
Waterfall Plots
Using R to make waterfall plots
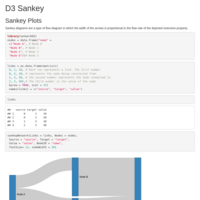
Making Sankey Plots with R and networkD3
Demonstration on making interactive Sankey plots with R and networkD3.This post is an amalgam of various gists and solutions on Stack Exchange.
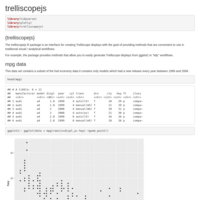
Exploration of the trelliscopejs R package
The output is interactive and can not be run in R markdown
Inference Procedures With R - Worked Example
A demonstration on how to use R for an exercise from a Royal Statistical Society examination paper (Module 3 2011 Question 3)

Inference Procedures With R - Worked Example
A demonstration on how to use R for an exercise from a Royal Statistical Society examination paper (Module 3 2011 Question 1)
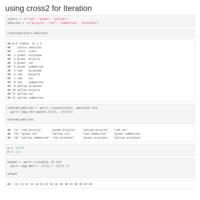
Iteration using cross2
An alternative to nested loops using the "cross2()" function trom the {purrr} pacakge
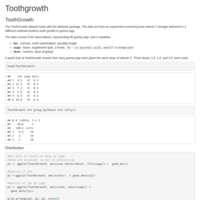
Toothgrowth Data
Statistical Analysis of Toothgrowth data set. This is the second part of project work for the Statistical Inference module for Coursera's Data Science Specialization
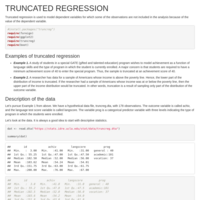
Truncated Regression
Truncated regression is used to model dependent variables for which some of the observations are not included in the analysis because of the value of the dependent variable.
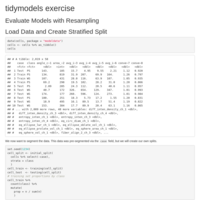
Resampling with tidymodels
Resampling with tidymodels
tidymodels exercise
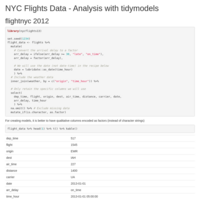
Using {tidymodels} with the NYCflights13 data
Diagnostics for LMEs with R
The R package {influence.ME} allows you to compute measures of influential data for mixed effects models generated by {lme4}.
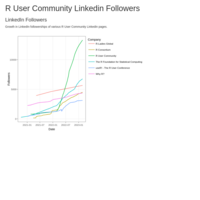
R User Community Linkedin Followers
Growth in followership of variousR User Community language company pages on LinkedIn
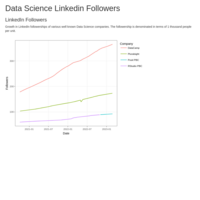
Data Science Linkedin Followers
Growth in followership of various Data Science language company pages on LinkedIn
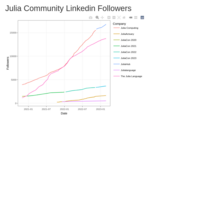
Julia Community Linkedin Followers
Growth in followership of various Julia programming language company pages on LinkedIn

Kaplan-Meier Analysis on Ovarian Cancer Data
Worked Example of a CS2B R programming actuarial exam question, featuring Survival Analysis
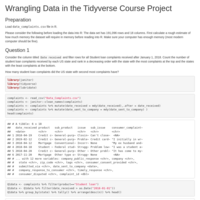
Wrangling Data in the Tidyverse - Course Project
Homework exercise for the "Wrangling Data in the Tidyverse Project" module in the Tidyverse Skills for Data Science in R Specialization
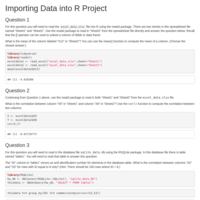
Importing Data into R Project
Homework exercise for the "Importing Data into R Project" module in the Tidyverse Skills for Data Science in R Specialization

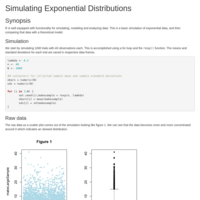
Exponential Distribution
Worked Example of a CS1B R programming actuarial exam question, featuring the Exponential Distribution
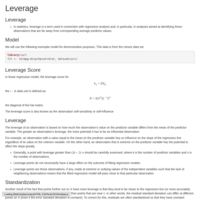
Leverage
In statistics, leverage is a term used in connection with regression analysis and, in particular, in analyses aimed at identifying those observations that are far away from corresponding average predictor values.
Cook's Distance for Linear Models
A look at Cook's Distance for appraising and identifying influential observation in linear models in R.
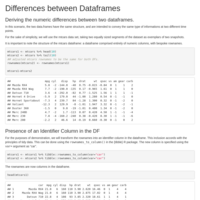
Differences Between Dataframes
Demonstration on how to create a dataframe that comprises differences between two snapshot data frames, i.e. dataframes of identical construction, but containing information at different timepoints
Actuarial Exams -Worked Example
Worked Example of a CS2B R programming actuarial exam question, featuring simulated Claim values

Mortality Investigation Analysis
Worked Example of a CS2B R programming actuarial exam question, featuring Mortality Investigation Analysis

K-Means Cluster Analysis
Worked Example of a CS2B R programming actuarial exam question, featuring K-Means Cluster Analysis
Cox Proportion Hazard Regression - Part 1
Worked Example of a CS2B R programming actuarial exam question, featuring Cox Regression
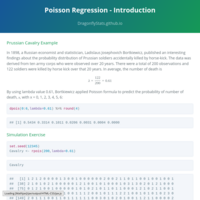
Poisson Distribution - Dispersion Parameter
An examination of the Dispersion Parameter, which informs on which approach to use when modelling count variables.
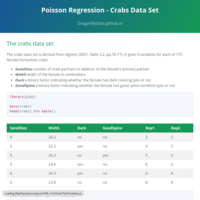
Poisson Regression - Crabs Data Set
Poisson Regression example using the crabs data set (from the {glm2} R pacakge. This data set is derived from Agresti (2007, Table 3.2, pp.76-77). It gives 4 variables for each of 173 female horseshoe crabs.
Compound Distribution - Simulation Example
Worked Example of a CS2B R programming actuarial exam question, featuring the simulation of a compound probability distribution
Time Series Analysis - Air Passengers
Worked Example from the CS2B R programming actuarial examination. This is a time series analysis example using the Air Passengers data set.
Time-variant Transition Matrices
Worked example of CS2B R programming actuarial exam question

Lognormal Distribution - Worked Example
Worked Example of an exercise on a CS1B R programming exam paper
Measures Of Influences
Using DFFITS, DFBETA and PRESS to determine influential observations in a fitted linear model
Model Diagnostics - Testing for Homoscedasticity
Demonstration of how to perform the test for homoscedasticity of residuals of a linear model using the {car} R package
Durbin-Watson Test for Autocorrelation
Demonstration of how to perform the Durbin-Watson test for a linear model using the {car} R package
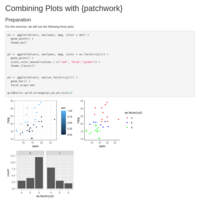
Demonstration of Patchwork R package
Demonstration of Patchwork R package. This is course material for the "Visualizing Data in the Tidyverse" which is part of the "Tidyverse Skills for Data Science in R Specialization"
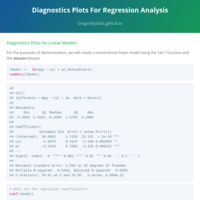
Diagnostics Plots For Regression Analysis
Demonstration of how to create simple model diagnostic plots using in-built function in R
Tobit Regression
Demonstration of Tobit Regression
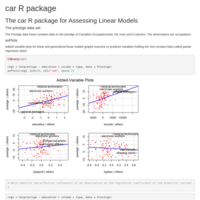
Model diagnostic tools with car R package
Demonstration of the functions offered by the car R package for model diagnostics. Here the R package is used to assess linear models fitted on the prestige dataset.
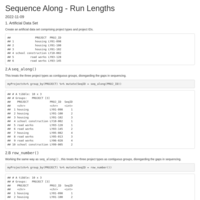
Sequencing and Run-length Encoding
Various options for sequence indices for data frames
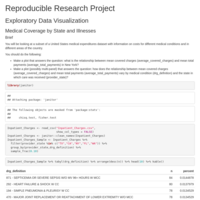
Reproducible Research Project
Working with a subset of a United States medical expenditures dataset with information on costs for different medical conditions and in different areas of the country.
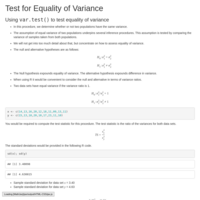
Testing Equality of Variance
Using the "var.test()" function in R to assess the validity of statistical assumptions in inference procedures
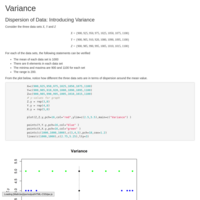
Measures of Dispersion
Demonstration of the intuition of Variance and Standard Deviation as measures of dispersion in statistics
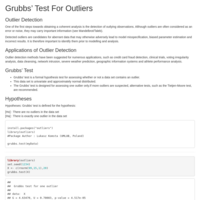
Grubb's Test for Outliers
Implementation of the Grubbs' Test for Outliers in a univariate data set using R.
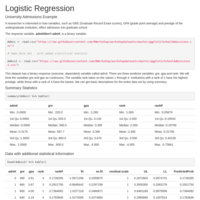
School Admissions
Using logistic regression to predict university admission.
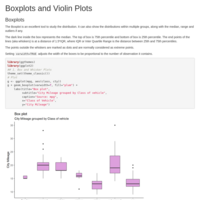
Boxplots and Violinplots
Using {ggplot2} to assess the distributions of univariate data, comparing across categories
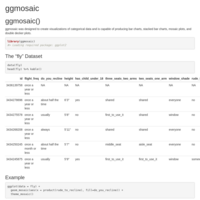
ggmosaic
Demonstration of ggmosaic R package for visualizing categorical data
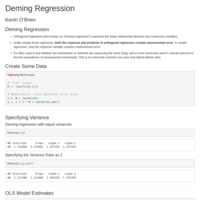
Deming Regression
A demonstration of Deming Regression, an interesting alternative to OLS regression models that has applications in Method Comparison Studies
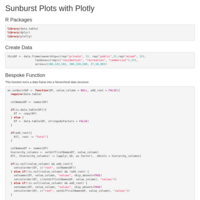
Creating Sunburst Plots with Plotly
This approach require a bespoke function that transforms a dataframe into a suitable hierarchical data structure
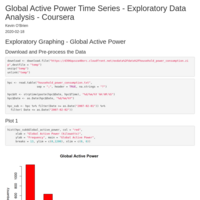
Exploratory Data Analysis - Assignment 1
Cousera's Data Science Specialization
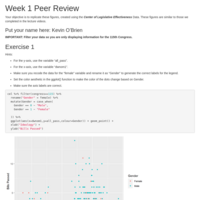
Data Visualization in R with ggplot2 - Assignment 1
Data Visualization in R with ggplot2 - Assignment 1
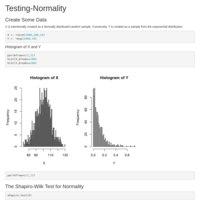
Testing Normality With R
Draft One
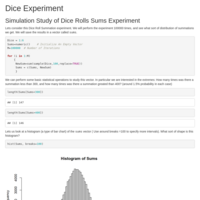
Dice Roll Experiment
Draft 1