DrunkenPhD
ENDRI RACO
Recently Published


Next Word Shiny Application Presentation
John Hopkins Data Science
Capstone Project
Shiny App

Next Word Prediction Shiny App
John Hopkins University Capstone Project
Presentation of Shiny App

Shiny App Next Word Prediction Presentation
John Hopkins University Data Science Capstone Project
Shiny App Next Word Prediction
Presentation

Coursera Milestone Report
Exploratory Data Analysis

AlbanianNames
Presentation of project

albaniamap
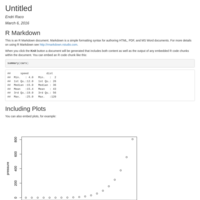
Web page presentation using R Markdown that features a plot created with Plotly.

My hometown Korca
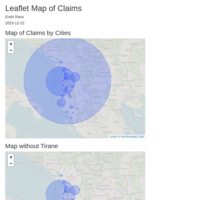
A web page using R Markdown that features a map created with Leaflet.
Webpage contains the date I created the document, and it contains a map created with Leaflet. Have a nice journey!
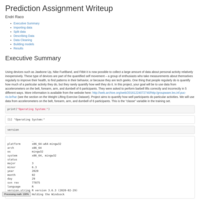
Prediction Assignment WriteUp
Using devices such as Jawbone Up, Nike FuelBand, and Fitbit it is now possible to collect a large amount of data about personal activity relatively inexpensively. These type of devices are part of the quantified self movement – a group of enthusiasts who take measurements about themselves regularly to improve their health, to find patterns in their behavior, or because they are tech geeks. One thing that people regularly do is quantify how much of a particular activity they do, but they rarely quantify how well they do it. In this project, your goal will be to use data from accelerometers on the belt, forearm, arm, and dumbell of 6 participants. They were asked to perform barbell lifts correctly and incorrectly in 5 different ways. More information is available from the website here: http://web.archive.org/web/20161224072740/http:/groupware.les.inf.puc-rio.br/har (see the section on the Weight Lifting Exercise Dataset).
Project aims to quantify how well participants do particular activities. We will use data from accelerometers on the belt, forearm, arm, and dumbell of 6 participants. This is the “classe” variable in the training set.
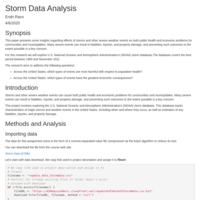
Storm Data Analysis
This paper presents some insights regarding effects of storms and other severe weather events on both public health and economic problems for communities and municipalities. Many severe events can result in fatalities, injuries, and property damage, and preventing such outcomes to the extent possible is a key concern.
For this research we will explore U.S. National Oceanic and Atmospheric Administration’s (NOAA) storm database.The database covers the time period between 1950 and November 2011.
The research aims to address the following questions:
Across the United States, which types of events are most harmful with respect to population health?
Across the United States, which types of events have the greatest economic consequences?
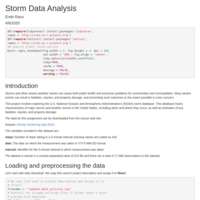
Storm Data Analysis
Storms and other severe weather events can cause both public health and economic problems for communities and municipalities. Many severe events can result in fatalities, injuries, and property damage, and preventing such outcomes to the extent possible is a key concern.
This project involves exploring the U.S. National Oceanic and Atmospheric Administration's (NOAA) storm database. This database tracks characteristics of major storms and weather events in the United States, including when and where they occur, as well as estimates of any fatalities, injuries, and property damage.