
E_Raviv
Eran Raviv
Recently Published
HTML
syl
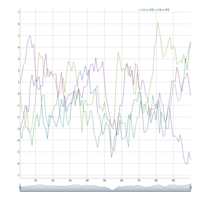
Time Series Visualization
Time Series Visualization
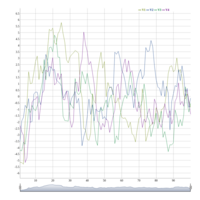
dygraph example
dygraph example
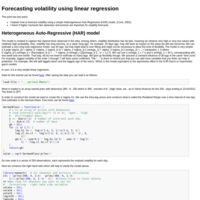
Forecasting volatility using linear regression
I show how to produce volatility forecasts using Realized Range measures. The forecasts are linear in lags so can be produced using the simple "lm" function. I also provide the data for the tutorial, intra-day prices, minute by minute for the S&P 500 ETF (Ticker is SPY).