Recently Published
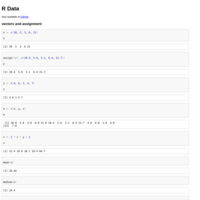
R Data
R data type examples
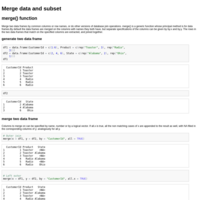
Merge data and subset
merge(), subset(), with(), duplicated(), %in%
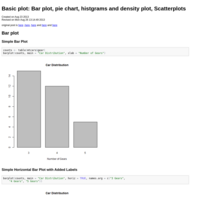
Basic plot: Bar plot, pie chart, histgrams and density plot, Scatterplots
Basic plot: Bar plot, pie chart, histgrams and density plot, Scatterplots, Labeling points and Add a legend with the legend() function
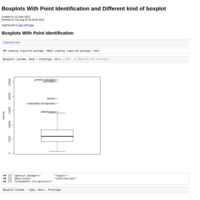
Boxplots With Point Identification and Different kind of boxplot
Boxplot, Notched Boxplot, Boxplots With Point Identification, Violin Plots, Bagplot
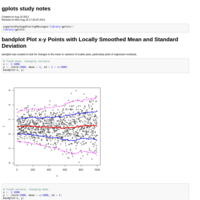
gplots study notes
Plot x-y Points with Locally Smoothed Mean and Standard Deviation, Enhanced Heat Map, lowess Scatter Plot Smoothing, Plot Error Bars and Confidence Intervals, Plot Group Means and Confidence Intervals
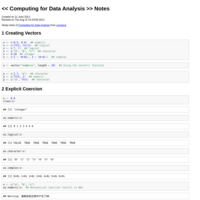
<< Computing for Data Analysis >> Notes
Creating Vectors, Explicit Coercion, Matrices, Lists, Factors, Missing Values, Data Frames, Names, Subsetting, Partial Matching, Removing NA Values, Vectorized Matrix Operations, Control Structures, Functions, Looping on the Command Line, apply, split, Simulation, Plot, Lattice, Regular Expressions,Dates and Times, Classes and Methods
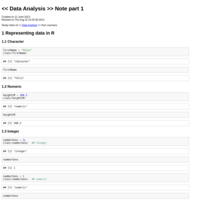
<< Data Analysis >> Note part 1
Representing data in R, Simulation basics, Structure of a Data Analysis, hclust, glm, Getting Data, Summarizing data, Data munging basics, Exploratory graphs, Expository graphs, Save the plot file, Hierarchical clustering, K-means clustering, Principal components analysis and singular value decomposition
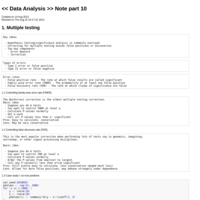
<< Data Analysis >> Note part 10
Multiple testing, Simulation for model checking, {UsingR}, {bootstrap}
<< Data Analysis >> Note part 8
Smoothing, loess (Local Polynomial Regression Fitting), {splines}, lm
<< Data Analysis >> Note part 9
The bootstrap {boot}, Bootstrapping for prediction {ipred} {randomForest}
<< Data Analysis >> Note part 7
Prediction study design, Predicting with regression models (lm, glm), Predicting with trees
<< Data Analysis >> Note part 6
ANOVA with multiple factors/variables, Linear regression, logistic regression, Poisson regression, Model checking and model selection,
K-means
K-means Clustering
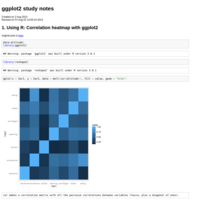
ggplot2 study notes
Correlation heatmap;
Principal component analysis part 1
Two informative PCA plots of principal component analysis
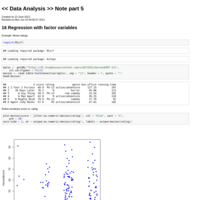
<< Data Analysis >> Note part 5
Regression with factor variables, anova, Multiple regression, Regression in the real world,
<< Data Analysis >> Note part 4
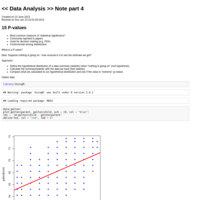
P-values, arrows, polygon
R download file from internet
download data, open browser
<< Data Analysis >> Note part 3
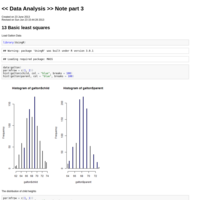
Basic least squares, Inference basics, lm, confint
<< Data Analysis >> Note part 2
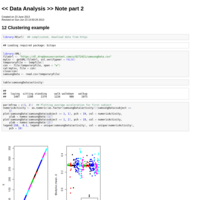
Clustering example: svd, hclust, kmeans
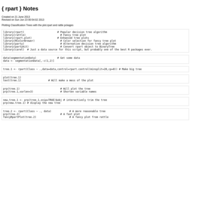
{ rpart } Notes
Plotting Classification Trees with the plot.rpart and rattle pckages
