
Geoyi
Zhuangfang Yi
Recently Published
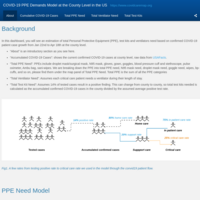
Covid-19 PPE demands at the county level in the US
by CovidCareMap
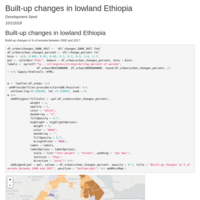
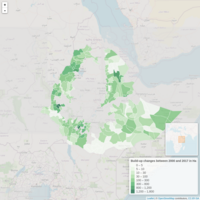
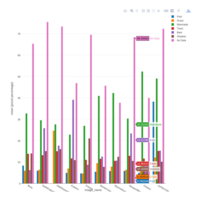
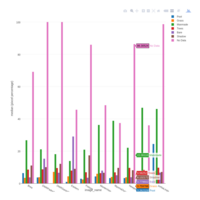
build-up_changes_et_ha
build up changes in ha
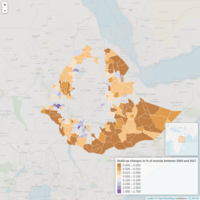
build-up_changes_et
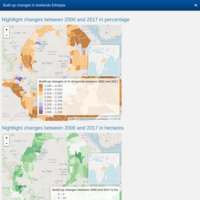
build up changes in percent in lowlands
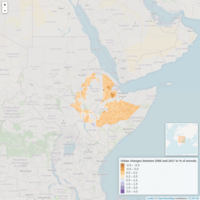
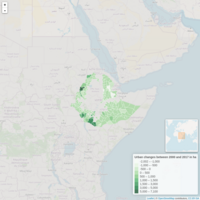
Urban_changes_et
Urban changes between 2000 and 2017 in Ethiopia lowlands


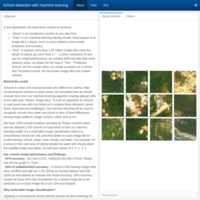
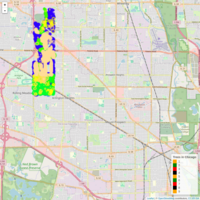
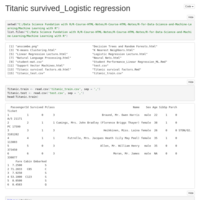
Mapping schools with machine learning
This dashboard is created to support GBDX Sustainability Challenge.
UNICEF is mapping every school in the world to improve children’s access to information and education. We, Development Seed (developmentseed.org), with UNICEF are exploring machine learning for school detection in Liberia.
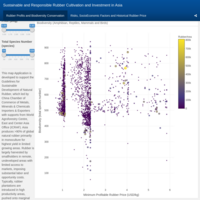

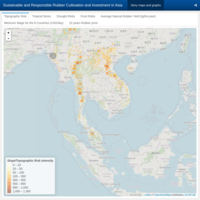
Rubber Risks and Biodiversity in Asia
Find Zhuangfang Yi at https://geoyi.org
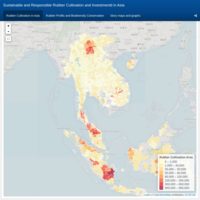
Rubber_In_Asia_Yi
Created by Zhuangfang Yi, https://geoyi.org
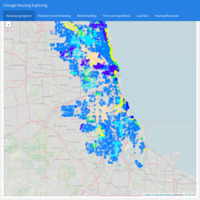
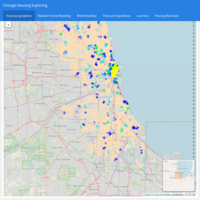
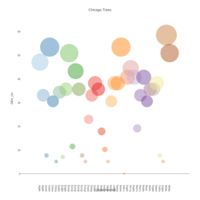
Greenspace_Property_Chicago
This is a capstone project demo for The Data Incubator, 2017 summer cohort from fellow Zhuangfang NaNa Yi
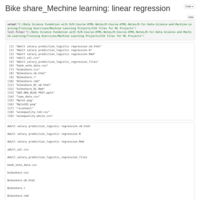
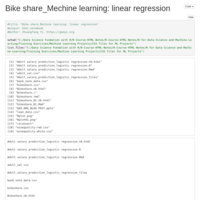
Bike share in DC using linear regression
This is a linear regression study case. I use data from http://kaggle.com. https://www.kaggle.com/c/bike-sharing-demand/data. to predict on a certain day that how many bikes will be needed in DC area
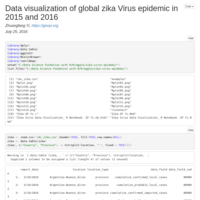
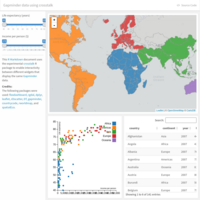
Data visualization of global zika virus epidemic in 2015 and 2016
This is a global zika virus epidemic data provided by CDC through Kaggle, and coded in R and data analysed by Zhuangfang Yi.