Recently Published
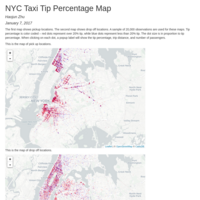
NYC Taxi Tip Percentage Map
Tip as a percentage of fare is visualized on these two maps of pick up and drop off locations. The data are from 20,000 observations randomly sampled from the green taxi data of September 2015.
Adult Dataset -- Income Prediction
Predict income using logistic regression and machine learning techniques.
Publish Document
peer assessment 2 for reproducible research
