
IAAC_MaCT
IAAC Master in City & Technology
Recently Published
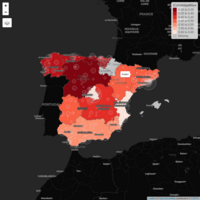
Regional healthcare system
The map reports data about the regional healthcare infrastructure. Demographic data is reported aggregated by region.
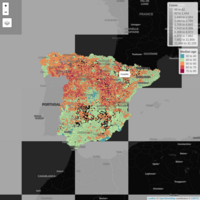
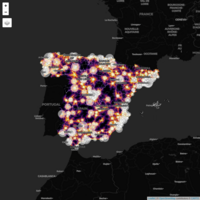
COVID-19 cases and Demography
The map reports the number of COVID-19 cases per region. Moreover, a dot map highlights the municipalities at a higher risk in consideration to the total population (the radius of the circles) and the median age (from brighter to darker)
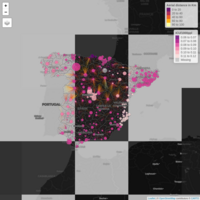
Relative availability of beds and Intensive care units
The map reports the location of the Spanish healthcare nodes with their relative availability of beds and ICU in relation to the number of citizens they serve by proximity. The radius of the circles is representative of the number of beds in the hospital per 1000persons while the color shows the availability of Intensive care units. The latter is mapped from regional data and it is indicatory,
Relative availability of beds
The map reports the location of the Spanish healthcare nodes with their relative availability of beds in relation to the number of citizens they serve by proximity. The radius of the circles is representative of the number of beds in the hospital per 1000 persons
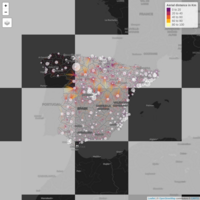
Accessibility to hospitals and absolute capacity
The map reports the location of the Spanish healthcare nodes with their hosting capacity and reachability on the territory. Starting from the hospitals and based on the road infrastructure plus the terrain morphology, a cumulative cost analysis is conducted in order to visualize their degree of accessibility. This map highlights the geolocalized unbalances of the national healthcare system and functions as a base to draw the hospital catchment areas.