JMawyin
Jose Mawyin
Recently Published


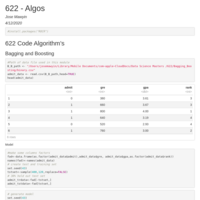
Chapter 8: Regression Trees and Rule-Based Models
Tree-based models consist of one or more nested if-then statements for the predictors that partition the data. Within these partitions, a model is used to predict the outcome.
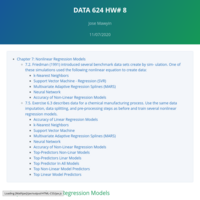
Chapter 7 Nonlinear Regression Models
There are numerous regression models that are inherently nonlinear in nature. When using these models, the exact form of the nonlinearity does not need to be known explicitly or specified prior to model training. This chapter looks at several models: neural networks, multivariate adaptive regression splines (MARS), support vector machines (SVMs), and K-nearest neighbors (KNNs).

Chapter 6 Linear Regression and Its Cousins
Discussion on several models, all of which are akin to linear regression in that each can directly or indirectly be written in the form
yi =b0 +b1xi1 +b2xi2 +···+bPxiP +ei

CUNY SPS - DATA 624: Project 1
Forecasting ATM Cash Withdrawals, Power Usage, and Water Flow.

CUNY SPS - DATA 624: Homework 6
Chapter 8 ARIMA models
ARIMA models provide another approach to time series forecasting. Exponential smoothing and ARIMA models are the two most widely used approaches to time series forecasting, and provide complementary approaches to the problem. While exponential smoothing models are based on a description of the trend and seasonality in the data, ARIMA models aim to describe the autocorrelations in the data.

CUNY SPS - DATA 624: Homework 5
Chapter 7 Exponential smoothing:
Exponential smoothing was proposed in the late 1950s (Brown, 1959; Holt, 1957; Winters, 1960), and has motivated some of the most successful forecasting methods. Forecasts produced using exponential smoothing methods are weighted averages of past observations, with the weights decaying exponentially as the observations get older.

CUNY SPS - DATA 624: Homework 4
Data Preprocessing and Overfitting

CUNY SPS - DATA 624: Homework 3
Chapter 6 Time series decomposition

CUNY SPS - DATA 624: Homework 2
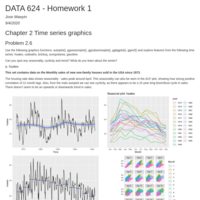
Chapter 3 The forecaster’s toolbox

Impact of Pricing Signal on Electricity Demand
**This study will analyze how effective was the day-ahead Pricing Signal notification in modifying the consumption of electricity of those users receiving notification versus those without it.**

Email Classifier Using Naive Bayes
This project will show how we can use *guided* machine learning to create a classifier able to sort spam and not-spam(ham) email. This is an example of guided machine learning because we will use a set of labeled data (ham/spam) to train our model.

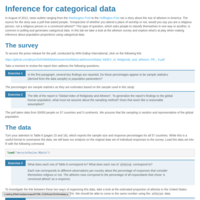
DATA 606 - Inference of Numerical Data
Speed and height. 1,302 UCLA students were asked to fill out a survey where they were asked about their height, fastest speed they have ever driven, and gender. The scatterplot on the left displays the relationship between height and fastest speed, and the scatterplot on the right displays the breakdown by gender in this relationship.
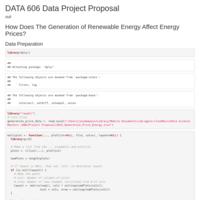
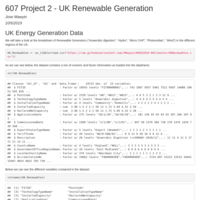
How Does The Generation of Renewable Energy Affect Energy Prices?
Energy markets were designed with the goal to trade energy produced by traditional energy generators such as coal, gas and nuclear plants. These generators are responsive to the forecasted future energy demand. This means that the energy generation at any moment can be controlled to meet the energy demand of a region. Under such conditions, the pricing of energy can be done in an environment of known expectations. However, energy generation from renewable sources such as Wind or Solar Energy depend on changing local conditions that cannot be controlled such as weather. Also, reneawble energy is generated at its full potential. For example, a wind turbine cannot be set a 50% generation like a coal station could be.
Renewable energy generation adds uncertainty in the energy market and therefore causes uncertainty in the price of energy. This study wants to understand how renewable energy generation, in this case Wind Energy, affected the price of energy in the United Kingdom in the year 2013.


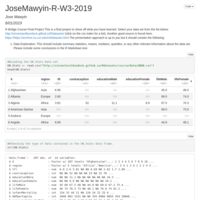
MSDS 2019 - Project 1 - Jose A. Mawyin
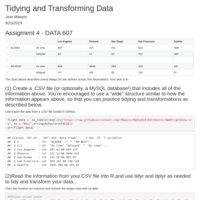
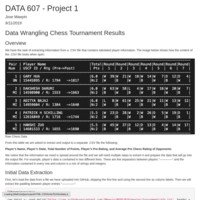
In this project, you’re given a text file with chess tournament results where the information has some structure. Your job is to create an R Markdown file that generates a .CSV file (that could for example be imported into a SQL database) with the following information for all of the players:
Player’s Name, Player’s State, Total Number of Points, Player’s Pre-Rating, and Average Pre Chess Rating of Opponents