JonMinton
Jonathan Minton
Recently Published

Unattended Deaths - Humanists Presentation
Presentation on Unattended Deaths Trends given to Edinburgh Humanists 8 January 2024
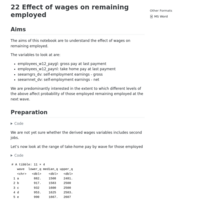
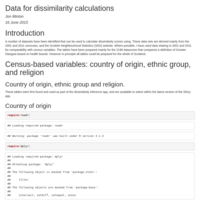
Effect of relative wages on remaining employed
Exploration of UKHLS on employed individuals on probability of remaining employed given different levels of wage relative to other sample members in the same wave
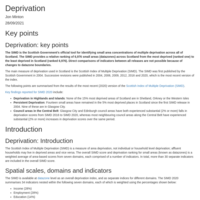
DRAFT update to SIMD section
Not for further sharing

Economic Inactivity Modelling in R
Presentation built using reveal.js-flavoured Quarto for Edinbr meetup talk on 24 November 2023

Economic Inactivity Modelling Example
An example of an approach to modelling the effect that various exposures, in addition to demographic variables, have on the probability of moving from and to different forms of economic (in)activity, and how this affects the size of the pool of the working age population in each of these states

uk_nations_projections
to compare life expectancies in UK nations against a range of projections based on earlier trends
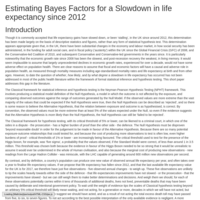
Bayes Factor for slowdown
Update earlier analysis to include uk's single year 2018 e0
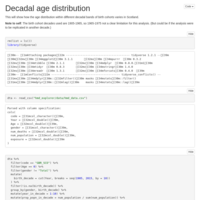
Decadal Age distribution
To explore if apparent improvements/changes could be due to treating whole decades as alike in terms of underlying age structure

Technical appendix
draft technical appendix for Fenton, Wyper, McCartney, Minton, ’Socioeconomic inequality in recent mortality trends in Scotland
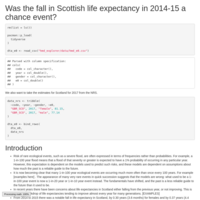
Quantifying 2014-15 fall in life expectancy as a rare event
This analysis looks at annual changes in life expectancy in Scotland (And England/Wales) and uses a 60 year series of such changes to quantify how rare the fall in life expectancy in 2014-15 was in this longer term context
indicator signal strength
What is the rank of the t-values for different World Bank indicators in models of age standardised all-cause, NCD mortality/DALY rates for males and females?
in a simple regression rate ~ year + indicator?
The tables at the bottom rank the t-values for males, showing also the ranks for females. Diff indicates the male - female ranks. t values < 2 for both genders are removed
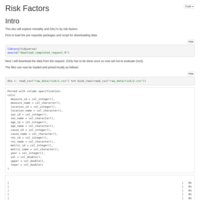
Risk factors
GBD risk factors - example of loading data and calculating basic trends

GBD, Gender, NCDs
Working notes. Global Burden of Disease Data. Gender differences, risk factors, with a focus on NCDs
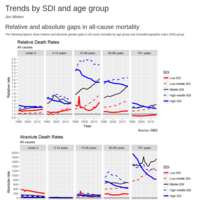
GBD: Trends by SDI and age group
Trends by SDI, age group, for relative/absolute differences in death rates, DALYs, incidence, YLLs, etc... for all cause and NCDs

Sage Course Example
Final published example from Martin Hadley's data vis course for Sage

Publish Plot
scatterplot of change in e50, e65 and e80 for males and females; and change in per capita spend; between 2009/10 and 2012/13