
KDVdecisions
Ashton Drew
Recently Published
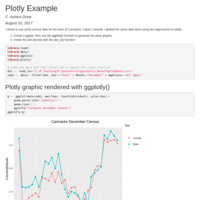
Plotly Example
Class exercise to create example plotly figure.
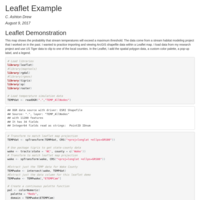
Leaflet Example
Just a quick example of viewing ArcGIS polygon data in a Leaflet map embedded within an R Markdown document.
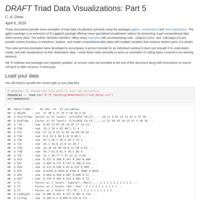
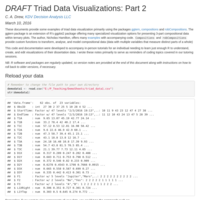
triad tutorial 5
Code to classify triads by bin and evaluate group membership. An alternative way to "cluster" data.

triad tutorial 4
Some examples relating triad clusters to dyad and factor variables with ggplot2 box plots and bar plots, respectively
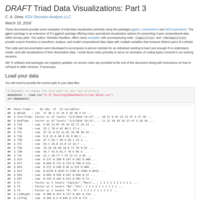
triad tutorial 3
Some sample code to calculate and plot the means of clusters within XY scatterplots and ternary plots. Also sample code to assign cluster id as a new variable for use as a grouping variable in data visualizations.
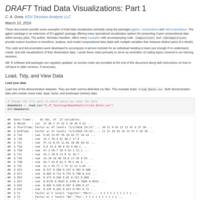
triad tutorial 2
Some sample code to define clusters in 3 part compositional data and plot these on a ternary plot with distinct colors.
ggtern triad tutorial 1
I am teaching some graduate students new to programming, R language, and stats to visualize three-part compositional data they have collected. This is the first in a series of labs I've developed for that purpose.
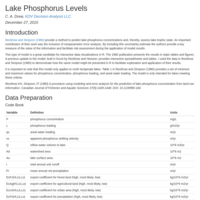
North Temperate Lake Phosphorus Model
Direct reproduction of the lake phosphorus model from: Reckhow & Simpson (1980) A procedure using modeling and error analysis for the prediction of lake phosphorus concentration from land use information. Canadian Journal of Fisheries and Aquatic Sciences 37(9):1439-1448. DOI: 10.1139/f80-184
My goal is to develop this model as an R Shiny example. This was the first stage: generating code that would reliably reproduce the published results.