Recently Published
Counting Floor Patients
A snippet of code used to calculate patients in the floor-excluding their ICU stays. Use this before pulling into a full dataframe.
Table 1 function
A function I wrote to attempt to make my life easier by automating table 1 output in R. Inspired by Ben Rich's table 1 function and the flextable package. Not a complete version, still under development.
Examining Medical Panel Expenditure Survey Data
A short script that I used to download MEPS data and create age/gender pyramids for some common heart conditions. I also make inroads into an initial exploration of out-of-pocket spending per patient.

Henra Virus Prevalence in the East Coast of Australia
In this vignette, I take a look at the data from a paper entitled 'Spatiotemporal Aspects of Hendra Virus Infection in Flying Foxes in Eastern Australia' and construct an R Shiny app to dynamically view spatial and temporal data.
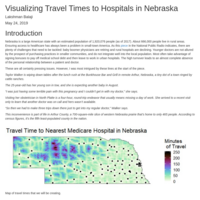
Rural Nebraska: Travel Times to Hospitals
Using the Malaria Atlas packages, I map out the time needed to travel to the nearest hospital from any point in Nebraska.

Text Analysis
A deep dive into the words used in anti-vaxxer blogs using wordclouds and sentiment analysis.
Predictive Analysis using R
A logistic regression model to predict patient no shows in Brazil using appointment times, diabetes, hypertension, SMS messages, scholarship, alcoholism and age.
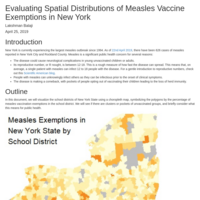
Measles Exemptions in New York State
A detailed explanation of how to using spatial operations to track measles exemptions by school district in New York State (NYS). To my knowledge, this is the first time this variable has been visualized for NYS using school districts as a geography.
Hospital Readmissions
I use t-tests to compare Medicare hospital readmissions data to verify a claim made in a news article.
Graphing Hospital Bed Density- US and India
A quick lesson on how to access public data to compare hospital bed density for two large countries.

Life Expectancy in R
A walkthrough of:
- Accessing World Bank Data to obtain life expectancy values
- Reshaping and joining non-spatial dataframes to spatial data frames.
- Visualizing data on a map as an animated gif.