
MTrungDang
Trung Dang
Recently Published


storytelling with data - SWD community
Undertake targeted practice by completing the latest exercise or browse the exercise bank and tackle one relevant to a current project or your data communication development goals.
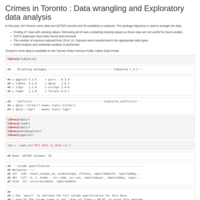

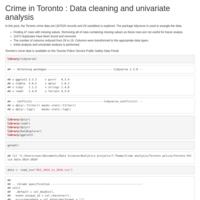
Crime in Toronto, Part 1: Data cleaning, initial analysis, and univariate analysis
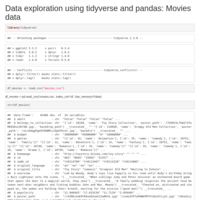
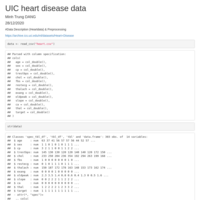
In this post, the package tidyverse is used to wrangle the Toronto crime dataset (167525 records and 29 variables).
* Finding 47 rows with missing values. Removing all of rows containing missing values as these rows are not useful for future analysis.
* 11973 duplicates have been found and removed.
* The number of columns reduced from 29 to 19. Columns were transformed to the appropriate data types.
* Initial analysis and univariate analysis is performed.