
MarkusLoew
Markus
Recently Published
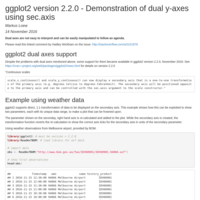
Demonstration of dual y-axes (one y-axis left, onother one on the right)using sec.axis - ggplot2 version 2.2.0
An example showing the new dual y-axes feature in ggplot2, version 2.2.0. Using the new sec.axis option with data transformation to show two individual parameters in a plot, each parameters using its own y-axis. Dual axes plots are easy to manipulate, are not easy to understand, as described here: http://stackoverflow.com/a/3101876
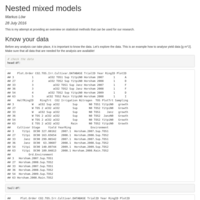
Nested models
Some thoughts, caveats on the use of nested models in a nested experiment.
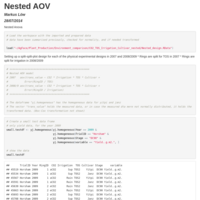
Nested Aov
Example of nested Anova
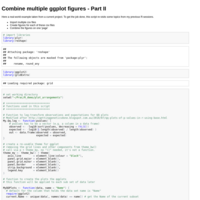
Combine multiple ggplot figures - Part II
A more elaborate example on how to align multiple ggplot via grid.arrange and grid.draw
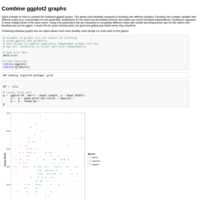
Combine ggplot2 graphs
Quick example how to combine two individual ggplot2 graphs.
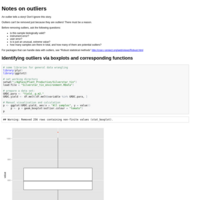
Notes on outliers
An outlier tells a story! Don't ignore this story.
Oultiers can't be removed just because they are outliers! There must be a reason!
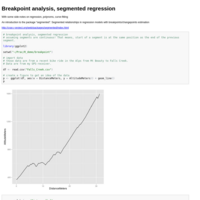
Breakpoint analysis, segmented regression
An introduction to the package "segmented": Segmented relationships in regression models with breakpoints / changepoints estimation.
Plus some side-notes on regression, polynoms, curve-fitting...
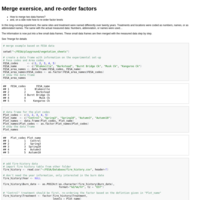
Merge exercise, and re-order factors
Merge example
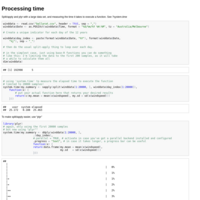
Processing time
Check the processing times when analysing larger data sets. Different approaches or packages used can speed up a specific task.
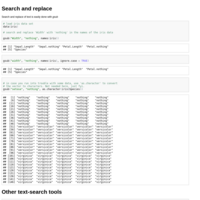
Search and replace
Some search and replace options for character elements
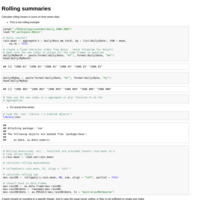
Rolling
Rollapply
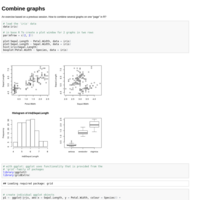
Combine graphs
An exercise with multiple graphs
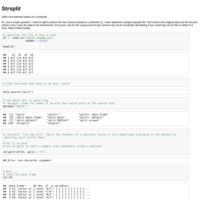
Strsplit
Split an element into multiple parts based on a given character.
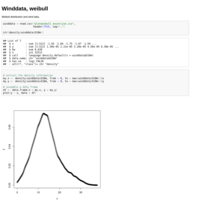
Winddata, weibull
Example analysis of wind speed distribution
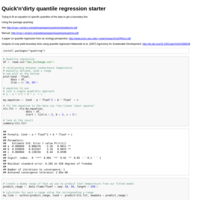
Quick'n'dirty quantile regression starter
just a rough script to get going with quantile regression via nlrq {quantreg}
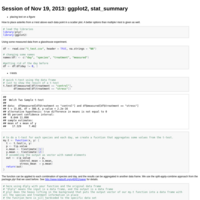
Session of Nov 19, 2013: ggplot2, stat_summary
ggplot layers, summaries and text, confidence bands, various error bars, ...
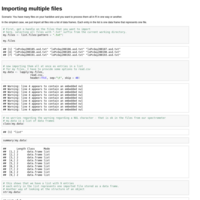
Importing multiple files
A few ways how to import multiple files into R in one go.
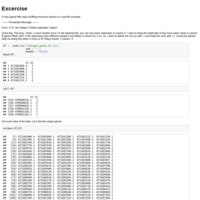
Excercise
A little excercise, based on a current question
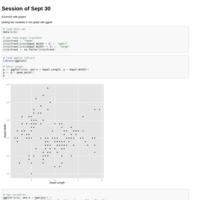
Session Sept 30, two variables in one plot
Repetition and excercise with graphs, plotting two variables in one graph with ggplot2
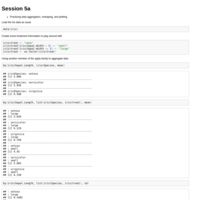
Session 5a
Practicing data aggregation, reshaping, and plotting
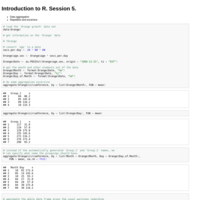
Introduction to R. Session 5.
Repetition
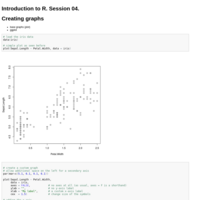
Introduction to R. Session 04.
Graphs - some base plots and ggplot. Advanced "base" plots: formatting, multiple axes
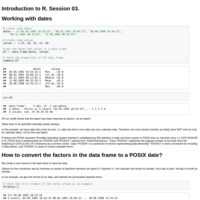
Introduction to R. Session 03.
Working with dates
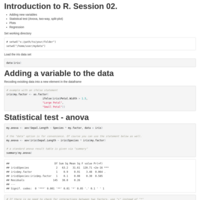
Introduction to R Session 02.
Adding new variables, Statistical test, Plots, Regression
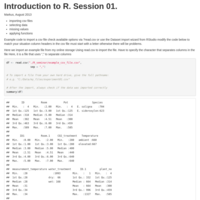
Introduction to R. Session 01.
importing csv files, selecting data, applying functions, aggregation of data
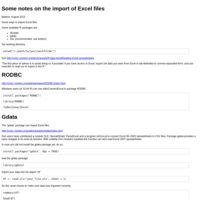
Some incomplete notes on the import of Excel files
The first piece of advice is: avoid using Excel. See http://cran.r-project.org/doc/manuals/R-data.html#Reading-Excel-spreadsheets
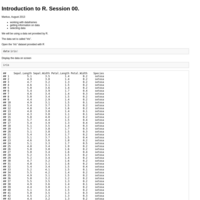
Introduction to R. Session 00
The first R session for the R workshop. Working with a simple data frame, selecting data.