MaryamM
Maryam
Recently Published

Project 4 Version 0
Individual Task

Project 4 Version 1
Group Task


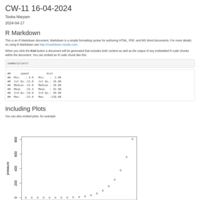
CW-11 16-04-2024
Linear Regression
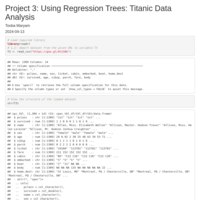
Project 3 Using Regression Trees: Titanic Data Analysis
For each question, write the corresponding R command & attach the relevant graphs.
1) Select import dataset as csv from https://goo.gl/At238b
2) Load into R into a variable called T3
3) Build a new dataset, titanic, by selecting these features:
survived, embarked, age, sex, sibsp, parch and fare.
4) Perform a statistical analysis of the titanic dataset.
5) Survived is the dependent variable, find its proportion in the dataset.
6) Remove NAs if any.
7) Make Survived embarked and sex as factors.
8) Find the correlation matrix between survival and the other features.
9) Plot survival with other features to see if any correlation exists
10) Set a seed to 1000 and use it to split the dataset into 80% training, 20% testing
11) Build your training (till index 1046) and test (till index 1308) datasets
12) Download the rpart for “Recursive Partitioning and Regression Trees” if it is not in your R base and bring it in your environment.
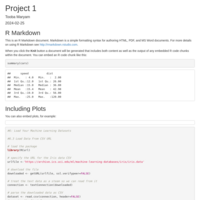
13) Train your learner on the training dataset and save your model in a variable fit
fit <- rpart(Survived ~ Sex + Age + SibSp + Parch + Fare + Embarked,
data=train, method="class")
14) Plot your regression tree and save plot into an image file
15) You must have obtained a plot that is not very readable. In order to get a better tree, download the following packages and bring them into your environment: rattle, rpart.plot and RColorBrewer
16) Type the R command fancyRpartPlot(fit) to obtain a more readable plot
17) Examine the tree you obtained. What is the most “important” feature over which the tree first split? Do you agree with the Titanic slogan “ Women and children first!”
18) Use the predict function with your model fit to make predictions on the test dataset and save it in a variable Prediction:
Prediction <- predict(fit, test, type = "class")
19) Save the results in a data frame Results that will have two columns 1: PassengerSex =test$Sex, and 2: Survived = Prediction
20) Save your data frame in a .csv file by using
write.csv(Results, file = "Titanicdtree.csv", row.names = FALSE)
21) Submit your R code as a link to Rpubs and Titanicdtree.csv file on Blackboard by Tuesday, April 13th 2024.
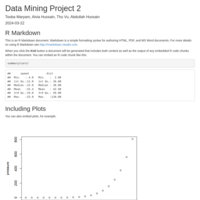
Project 2- Data Mining
-Using the dataset provided to your group, perform an analysis of your dataset and apply unsupervised learning (clustering).
1- Import the dataset to R
2-Perform a statistical analysis of the dataset
3- Find if any entries are NA and remove them
4- Normalize/standardize your dataset (Scale function)
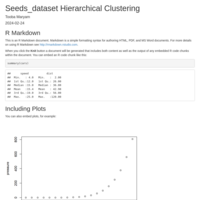
5- Apply the hierarchical clustering (try many cluster values)
6- Apply the K means clustering (try many cluster values )
7- Since the dataset is not labeled, you cannot use external validation/evaluation procedures. However, you can use the internal evaluation procedures, seen in class (silhouette coefficient and Dunn’s coefficient).
8- Analyze your results in terms of number of clusters, which k value gives the best result. Can you find a meaning to these clusters?
CW-6 05-03-2024
wisc_bc_dataset
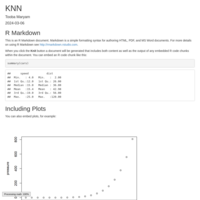
k-Nearest Neighbors (k-NN) algorithm

Project 1_S24
#6: Load Your Machine Learning Datasets
#7: Understand Your Data Using Descriptive Statistics
#8: Understand Your Data Using Data Visualization
#9: Prepare Your Data For Machine Learning With Pre-Processing

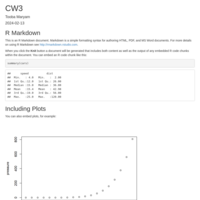
CW-3 13-02-2024
13-02-2024 CW-3