
Mayank7j_2020
Mayank Agrawal
Recently Published
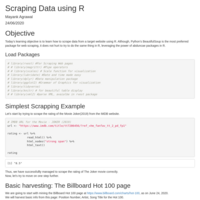
Web Scraping in R - Top 100 Songs from Bill Board
Today’s learning objective is to learn how to scrape data from a target website using R. Although, Python’s BeautifulSoup is the most preferred package for web scraping, it does not hurt to try to do the same thing in R, leveraging the power of packages in R.
RSI based Trading Signal
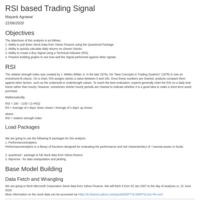
The objectives of this analysis is as follows.
1. Ability to pull down Stock Data from Yahoo Finance using the Quantmod Package.
2. Ability to quickly calculate daily returns on chosen Stocks.
3. Ability to create a Buy Signal using a Technical Indicator (RSI)
4. Practice building graphs to see how well the Signal performed against other signals.
Predict Diabetes using Pima Indians Data Set
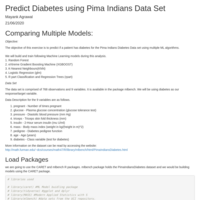
The objective of this exercise is to predict if a patient has diabetes for the Pima Indians Diabetes Data set using multiple ML algorithms.
We will build and train the following Machine Learning models during this analysis.
1. Random Forest
2. eXtreme Gradient Boosting Machine (XGBOOST)
3. K-Nearest Neighbours(KNN)
4. Logistic Regression (glm)
5. R part Classification and Regression Trees (rpart)
Predict Housing Age of Boston Housing Data
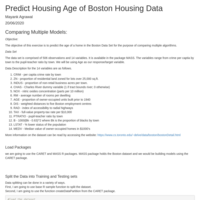
The hands-on project on Machine Learning: Predict Housing Age using the Boston Data Set: is divided into the following tasks:
Task 1: In this task, the Learner will be introduced to the Course Objectives, which is to how to execute a Random Forest Model using R and the Boston Housing Data set. There will be a short discussion about the Interface and an Instructor Bio.
Task 2: The Learners will get practice doing Exploratory Analysis using ggplot2. This is important in order for the practitioner to see the balance of the data, especially as it relates to the Response Variable.
Task 3: The Learner will get experience creating Testing and Training Data Sets. There are multiple ways to do this in R. The Instructor will show the Learner how to do it using the Base R way and also using a function from the caret package.
Task 4: The Learner will get experience with the syntax of the Caret, an R package. Then the Learner will create three models (Linear Regression, GBM, Random Forest) in one function call.
Task 5: The Learner will get practice compiling the model results from the various models to decide which one performed the best.
Task 6: The Learner will get practice looking and comparing multiple models using RMSE among other metrics.
Exploratory Data Analysis of Olympic Dataset
A detailed exploratory data analysis for the Olympic Dataset for the year 2000 to 2016. It follows the basic workflow of a data science analysis and is a good guide for plotting using for loops and different plots, which are clean and presentable.