Recently Published

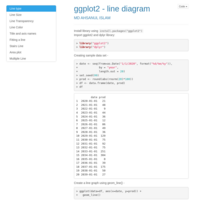
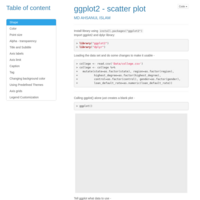
AiQuest ggplot2 Tutorial
This is a tutorial for ggplot2.

Titanic Data Analysis
In this project, I have explored individual variables' effect on survival rate. This, of course, is not something that extracts the maximum information from the dataset but shows how different R functions can be used to extract valuable information. I have extensively used dplyr and ggplot2 which was the main goal of this project.

Correlogram
Visualization of the correlation matrix.
EDA of Programming Club General Members 2023 DB
This project aims at showing various attributes of registered general members of the `Programming Club, Dept. of Statistics, CU” in 2023. I have used ggplot2 for the visualizations.
Missing Values Imputation
Some methodologies for missing values imputation and R code
Cluster Analysis
Discover various clustering techniques, such as hierarchical clustering, k-means clustering, as you delve into the process of grouping similar observations together to uncover patterns and structures in the data.

Using stat_function() and geom_function()
These are used to compute and draw a function as a continuous curve.
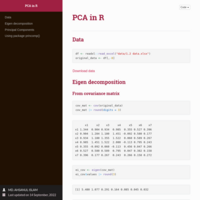
PCA in R
Only basic code on performing PCA in R.
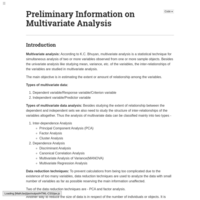
Preliminary Information on Multivariate Analysis
Discussion on centroid, variance-covariance matrix, correlation matrix.
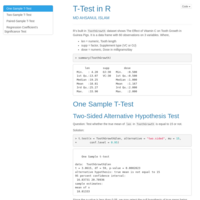
T-Test in R
Discussed various applications of the t.test() function in R.
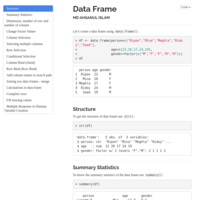
Data Frame in R
I've discussed on constructing a data frame using vectors, matrix to data frame conversion, selecting/sub-setting, re-leveling factorized values in data frame, joining two data frames in different manners.
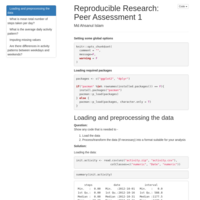
Reproducible Research - Course Project 1
Github repo - https://github.com/AhsanHimel/RepData_PeerAssessment1
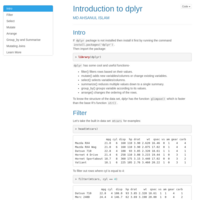
Introduction to dplyr
I have discussed on different functions of the popular dplyr package for data manipulation in R.
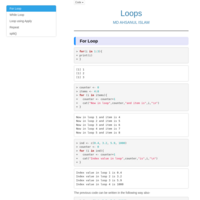
Loop in R
I have discussed about for loop, while loop, loop using apply and repeat loop.
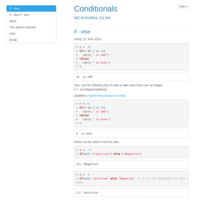
Conditional Operations in R
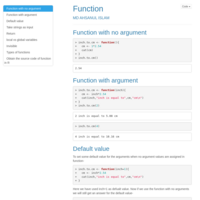
I have discussed about if, else, else if, switch, break and next.
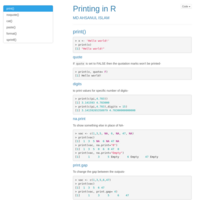
Printing methods in R
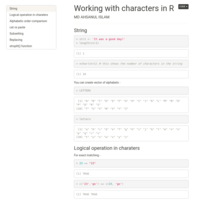
I have discussed about the functions print(), nonquote(), cat(), paste(), format() and sprintf().
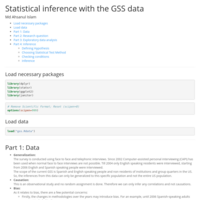
Statistical inference with the GSS data
This is my first project on Statistical Inference. This is done after finishing the course from Coursera taught by Mine Çetinkaya-Rundel of Duke University.
My research question here is, "Is political view of an individual USA citizen related to opinion towards the government expenses on improving education?"
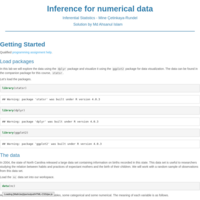
Inference for comparing means
This is my solution to the 3rd weeks lab exercise of the course - "Inferential Statistics by Mine Çetinkaya-Rundel" in Coursera.


