
Rajwantmishra
Rajwant Mishra
Recently Published
DRAFT WIP Project 3
DRAFT WIP Project 3
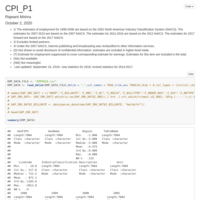
EMP_DATA PRE WORK
EMP_DATA PRE WORK
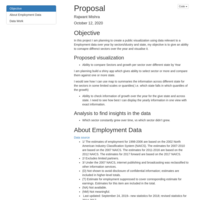
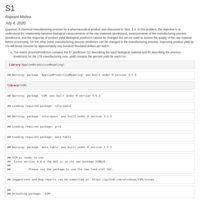
Proposal_608
Proposal_608
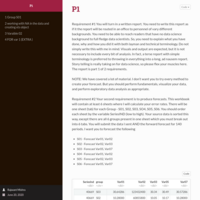
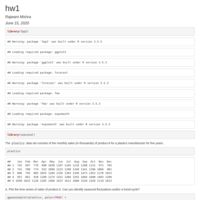
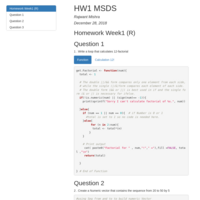
MS_608 HW 1
HW 1
DRAFT WIP Project 1
DRAFT WIP Project 1
-Lux-
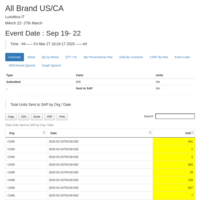
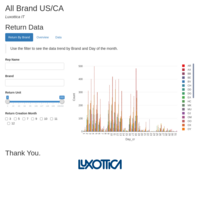
Lux Mar 22- Till Date
LUX
LUX
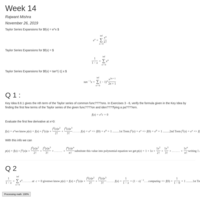
Discussion w14
Week 14 Discussion
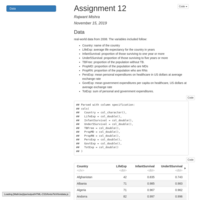
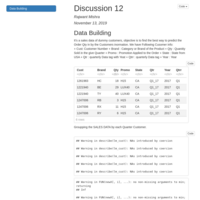
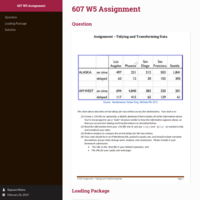
Assignment 12
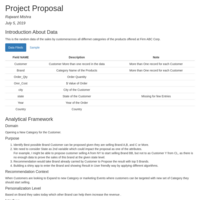
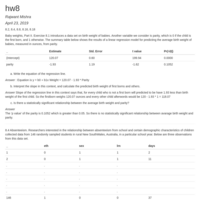
Country: name of the country
LifeExp: average life expectancy for the country in years
InfantSurvival: proportion of those surviving to one year or more
Under5Survival: proportion of those surviving to five years or more
TBFree: proportion of the population without TB.
PropMD: proportion of the population who are MDs
PropRN: proportion of the population who are RNs
PersExp: mean personal expenditures on healthcare in US dollars at average exchange rate
GovtExp: mean government expenditures per capita on healthcare, US dollars at average exchange rate
TotExp: sum of personal and government expenditures.
Discussion w12 _Reply
Insurance Dataset
Discussion w12
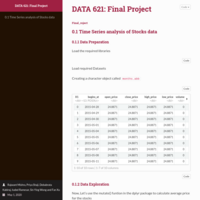
Sales Data Analysis
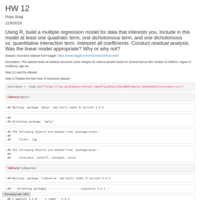
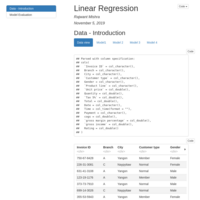
Linear Regression
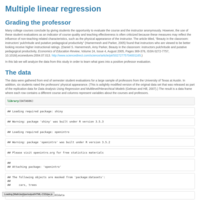
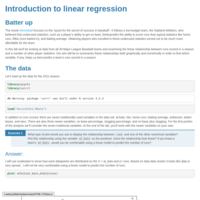
Using the “cars” dataset in R, build a linear model for stopping distance as a function of speed and replicate the analysis of your textbook chapter 3 (visualization, quality evaluation of the model, and residual analysis.)
•Predictor: Speed
•Response Variable: stopping distance
Discussion w11
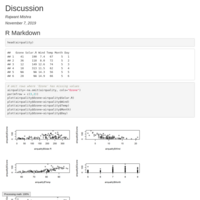
Discussion
Linear Regression
Linear Regression
Project 4 : Using SVD USER ITEM, ITEM ITEM Recommendation
Project 4 : Using SVD USER ITEM, ITEM ITEM Recommendation
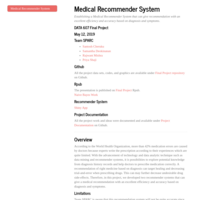
Project 5: Medical Recommender System
Medical Recommender System, Medical Recommender System
Establishing a Medical Recommender System that can give recommendation with an excellent efficiency and accuracy based on diagnosis and symptoms.
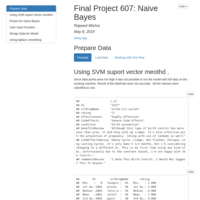
Project 5 : Naive Bayes based Symptoms Diseases Recommendation
Naive Bayes, TM, SVM, Use Mongo to save Model
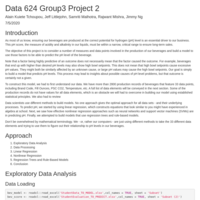
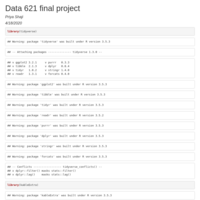
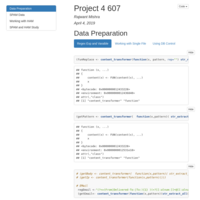
606 Project Marketing Analysis
April 24, 2019
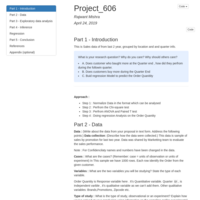
Part 1 - Introduction
Part 2 - Data
Part 3 - Exploratory data analysis
Part 4 - Inference
Regression
Part 5 - Conclusion
References
Appendix (optional)
Lab 8 Multiple linear regression"
Multiple linear regression
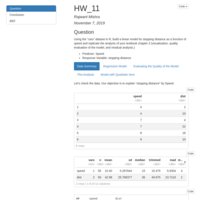
HW 8 Multiple Linear Regression
HW 8 Multiple Linear Regression
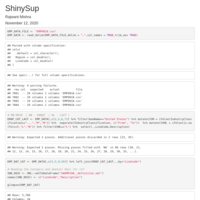
Working with Mongo DB using MongoLite
Working with Mongo DB, Upload, Query.and many more with mongolite package.
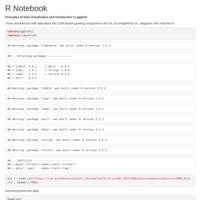
TidyVerse Recipe Part 2
TidyVerse Recipe Part 2
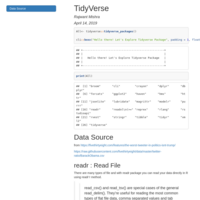
TidyVerse Recipe
TidyVerse Recipe
"broom" "cli" "crayon" "dplyr" "dbplyr" "forcats" "ggplot2" "haven" "hms" "httr"
"jsonlite" "lubridate" "magrittr" "modelr" "purrr" "readr" "readxl\n(>=" "reprex" "rlang" "rstudioapi"
"rvest" "stringr" "tibble" "tidyr" "xml2" "tidyverse"
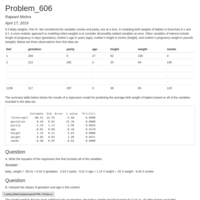
606 Problem
606 Problem
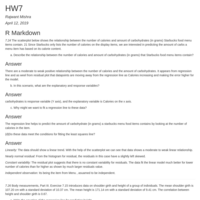
HW7 INTRODUCTION TO LINEAR REGRESSION
INTRODUCTION TO LINEAR REGRESSION
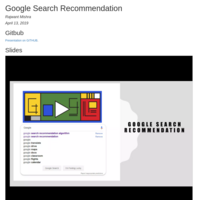
Google Search Recommendation PPT
Google Search Recommendation
Introduction to linear regression and Prediction
Introduction to linear regression, Sum of squared residuals
Working with Document Term Matrix (TM) Project 4
Working with TM and other text processing packages. Working with Train and Test concept for some part of the data. Working with SPAM and HAM dataset.
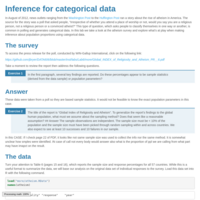
Inference for categorical data LAB 6
Inference for categorical data
In August of 2012, news outlets ranging from the Washington Post to the Huffington Post ran a story about the rise of atheism in America. The source for the story was a poll that asked people, “Irrespective of whether you attend a place of worship or not, would you say you are a religious person, not a religious person or a convinced atheist?” This type of question, which asks people to classify themselves in one way or another, is common in polling and generates categorical data. In this lab we take a look at the atheism survey and explore what’s at play when making inference about population proportions using categorical data.
Inference for categorical data HW
Inference for categorical data, Chi square, difference of two propotion
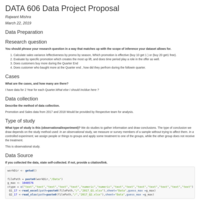
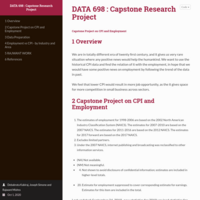
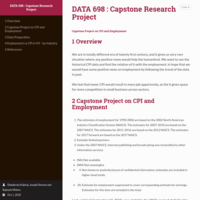
DATA 606 Data Project Proposal
DATA 606 Data Project Proposal
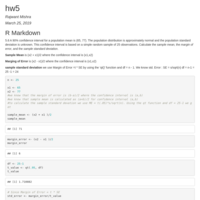
606 HW Week 5
Week 5 t-test, hypothesis testing.
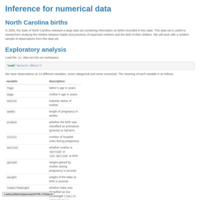
Inference for numerical data (Lab 5 )
hypotheses for testing
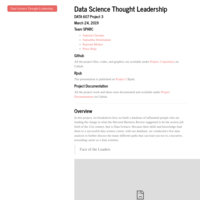
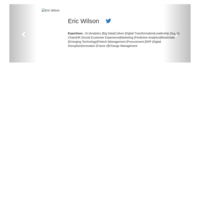
Project 3 Data Science Thought Leadership (Final )
In this project, we breakdown how we built a database of influential people who are leading the charge in what the Harvard Business Review suggested to be the sexiest job field of the 21st century, that is Data Science. Because their skills and knowledge lead them to a successful data science career, with our database, we conducted a few data analysis to further discuss the many different paths that can lead you too to a lucrative, rewarding career as a data scientist.
Data Science Thought Leadership
DATA 607 Project 3
March 24, 2019
Team SPARC
Santosh Cheruku
Samantha Deokinanan
Rajwant Mishra
Priya Shaji
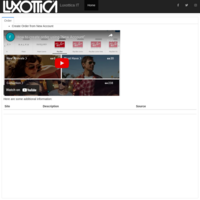
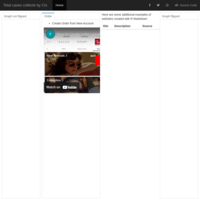
PPL IFRAME
PPL IFRAME

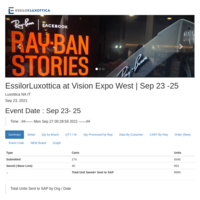
Lux Event
Lux Event 22 Sep
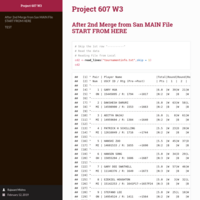
Project 3
Project 3
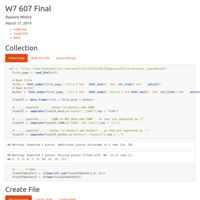
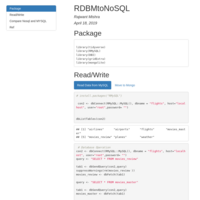
Read , Write, Create <==> HTML, XML,JSON with/without Mongo DB
I am using Mongo DB/Local to store , read data back and forth from Mongo (online)..
Read write and create HTML, XML, JSON.
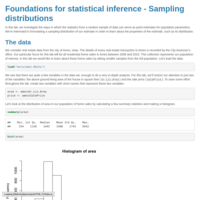
Foundations for statistical inference - Sampling distributions
sampling distribution, Sample Mean
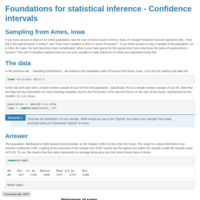
Foundations for statistical inference - Confidence intervals
`Sampling Distributions’, Confidence Interval, Critical value ,
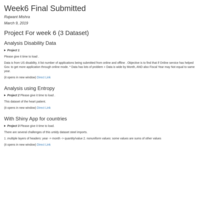
Week 6 Final Work
Project For week 6 (3 Dataset)
Analysis Disability Data
Analysis using Entropy
With Shiny App for countries
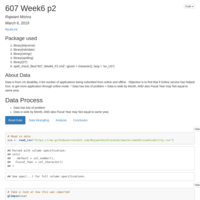
US disability data Project
Project 2 of 3 Week6 : Data is from US disability, it list number of applications being submitted from online and offline . Objective is to find that if Online service has helped Gov. to get more application through online mode. * Data has lots of problem + Data is wide by Month, AND also Fiscal Year may Not equal to same year.
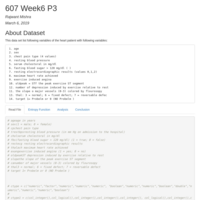
Entropy and Heart Data Analysis.
Project 3 of Week 6 : Entropy and Heart Data Analysis.
Flight Data
Analyse delay in Flight data
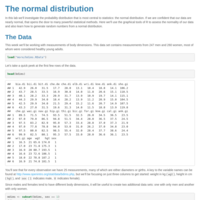
606 Lab 3
Using The normal distribution, QQPLOT, normal plot and GGPLOT density plot,

CLASS Demo
Presentation for 607
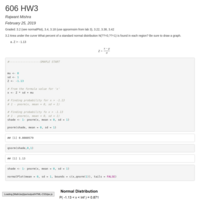
606 HW Week 4
Using PNORM, QNORM,quantile,This is a Negative Binomial distribution, using choose, using dbinom(0, 100, .02), Calculate success and failure probability in draw, # Here 9 is number of failure before success , dgeom(9,0.02)
Project work Internal
Self work on 607 project work
Group SPARK : 607 Project Work 1
In this project, you’re given a text file with chess tournament results where the information has some structure. Your job is to create an R Markdown file that generates a .CSV file (that could for example be imported into a SQL database) with the following information for all of the players:
Player’s Name, Player’s State, Total Number of Points, Player’s Pre-Rating, and Average Pre Chess Rating of Opponents.
Example For the first player, the information would be:
Gary Hua, ON, 6.0, 1794, 1605
Contributors:
Santosh Cheruku
Samantha Deokinanan
Rajwant Mishra
Priya Shaji
https://github.com/Rajwantmishra/ms-project-607_1
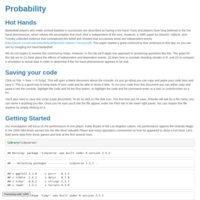
Probability and R
PROBABILITY, 2.6 Dice rolls. 2.8 Poverty and language, 2.20 Assortative mating., Books on a bookshelf. , Baggage fees, Income and gender

Probability Assignment
Know understand probability and sample generations .Lab2 work for 606.
Probability Assignment
Know and understand probability Assignment 3 Lab work 606
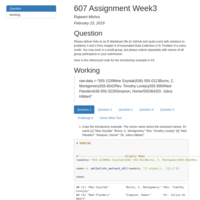
607 Week3 Assignment
Using string operations and extracting secret code from random text.
Heart Data
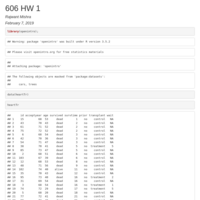
606 Assignment HW1
Jan 19
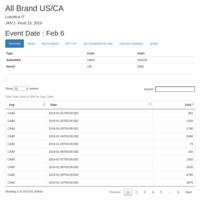
Lux Data
Data Analysis of health
Working with standard deviation, mean . Analyzing box plot and other graph.
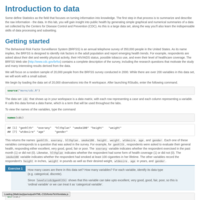
Data Scrapping and MySql Connection
607 Assignment 2: Scrap data, clean data, create DB table, update DB, Read DB
606 Lab 0
606 Lab 0 : Data of Birth by year
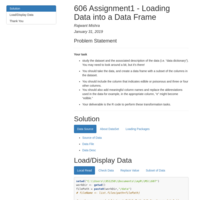
#606 Assignment 1
study the dataset and the associated description of the data (i.e. “data dictionary”). You may need
to look around a bit, but it’s there! You should take the data, and create a data frame with a subset of the columns
in the dataset. You should include the column that indicates edible or poisonous and three or four other columns.
You should also add meaningful column names and replace the abbreviations used in the data—for example, in the
appropriate column, “e” might become “edible.” Your deliverable is the R code to perform these transformation
tasks.
Project MSDS
Analysis of data from YouTube 5 videos comments . Using different types of data transformation and string operation to build meaningful analysis.
Data Analysis
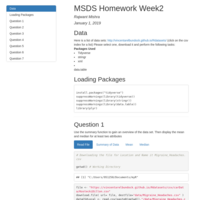
Using Package
Tidyverse
stringr
xml
library(data.table)
Learning
Tables
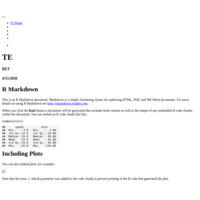
Document
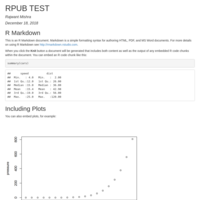
Test 1st PUBLISH