
RatherBit
Antonello Pareto
Recently Published
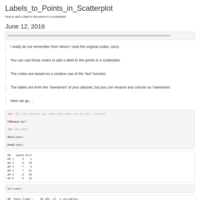
How to add a label to the points in a scatterplot
How to add a label to the points in a scatterplot and other tricks in basic R graphics
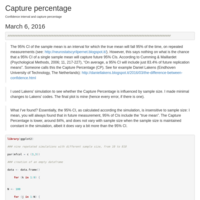
Confidence interval and capture percentage
This post is based on the codes that were used by Daniel Lakens in his post http://daniellakens.blogspot.it/2016/03/the-difference-between-confidence.html
This is a simulation that explores the relationship between the Confidence interval of a sample mean and the so-called Capture percentage.
According to Cumming & Maillardet (Psychological Methods, 2006; 11, 217-227), "On average, a 95% CI will include just 83.4% of future replication means". I've found this is reasonably true, but with a 99.5% CI, the Capture percentage of the 99.5% CI of a sample mean is a pretty satisfying 95%.
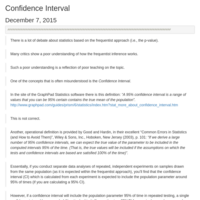
Confidence Interval
A short exploration of the concept within the frequentist approach, with a take-home message. With codes for simulations.
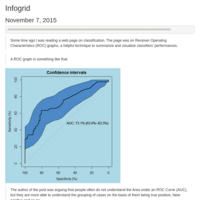
Infogrid for ROC analysis
The post describes a function to plot an infogrid, which is a useful method to illustrate the Receiver Operating Characteristics (ROC) space at hand. Essentially, the infogrid plots the distribution of true positive (TP), true negative (TN), false negative (FN), and false positive (FP) cases as predicted by a classifier.
A ROC curve is a graphical representation of the relationship between sensitivity and specificity of a classifier and it helps to identify the best threshold for a diagnostic test. The area under the curve (AUC) is a measure of how good the classifier is in detecting the condition of interest in a sample.
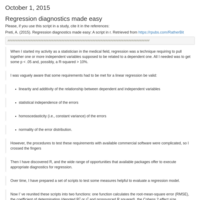
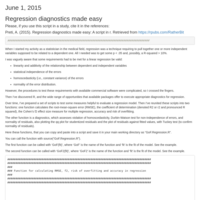
Regression diagnostics made easy - Fixed Minor bugs
A set of scripts to test some measures helpful to evaluate a regression model. One function calculates the R-squared and the adjusted R-squared (with 95% CI), the predictive R-squared, the root-mean-square error (RMSE), the Cohen’s ƒ2 effect size measure for multiple regression, accuracy and risk of overfitting. The other function is a diagnostics, which assesses violation of homoscedasticity, Durbin-Watson test for non-independence of errors, the Ramsey Regression Equation Specification Error Test (RESET), which tests for misspecification of the model, and normality of residuals, also plotting the qq plot for studentized residuals and the plot of residuals against fitted values, with Tuckey test (to confirm normality of residuals).

Rolling a dice, flipping a coin - A bit of fun with R
Rolling a dice is the quintessence of hazard and probability. Some exercises with the 'Animation' and the 'TeachingDemos' packages on the binomial related distributions.
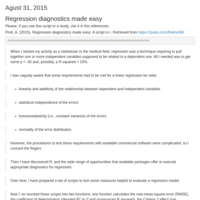
Regression diagnostics made easy - Update
A set of scripts to test some measures helpful to evaluate a regression model. One function calculates the R-squared and the adjusted R-squared (with 95% CI), the predictive R-squared, the root-mean-square error (RMSE), the Cohen’s ƒ2 effect size measure for multiple regression, accuracy and risk of overfitting. The other function is a diagnostics, which assesses violation of homoscedasticity, Durbin-Watson test for non-independence of errors, the Ramsey Regression Equation Specification Error Test (RESET), which tests for misspecification of the model, and normality of residuals, also plotting the qq plot for studentized residuals and the plot of residuals against fitted values, with Tuckey test (to confirm normality of residuals).
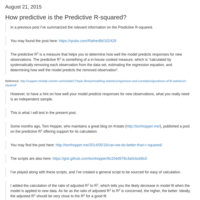
How predictive is the Predictive R-squared?
The predictive R-squared is a measure that helps you to determine how well the model predicts responses for new observations. Some months ago, Tom Hopper (http://tomhopper.me/) published a post on the predictive R-squared offering support for its calculation.
In this tutorial, the capacity of the predictive R-squared of really predict the R-squared in an independent sample is tested with both simulated and real data.
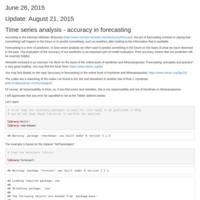
Time series analysis - accuracy in forecasting
Updated tutorial on how to evaluate the accuracy of various methods of forecasting. All exercises were done on the basis of the online book of Hyndman and Athanasopoulos “Forecasting: principles and practice”, a very good reading
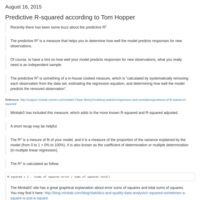
Predictive R-squared according to Tom Hopper
A recap on the predictive R-squared and its utility in evaluating the fit of a linear regression, with an implementation of the codes provided by Tom Hopper in his blog.
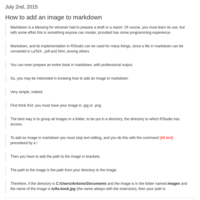
How to add an image to markdown
A shor tutorial on how to add images to markdown and how to change the color in the text of a markdown file

Always plot the data! - Part one
Exploratory data analysis and its visualization has always been an important part of statistics. Indeed, graphics reveal data, as stated by Edward R. Tufte in its seminal book "The Visual Display of Quantitative Information".
In this tutorial, examples are offerend, with codes, about data visualization, which is preliminary to any data analysis.
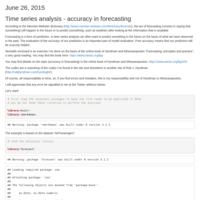
Time series analysis - accuracy in forecasting
A tutorial on how to evaluate the accuracy of various methods of forecasting.
All exercises were done on the basis of the online book of Hyndman and Athanasopoulos “Forecasting: principles and practice”, a very good reading
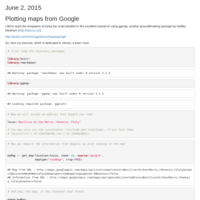
Plotting maps from Google with ggmap
An exercise on plotting maps from Google with gmap
Regression diagnostics made easy
The post summarizes a set of scripts to test some measures helpful to evaluate a regression model. One function calculates the root-mean-square error (RMSE), the coefficient of determination (denoted R2 or r2 and pronounced R squared), the Cohen’s ƒ2 effect size measure for multiple regression, accuracy and risk of overfitting.
The other function is a diagnostics, which assesses violation of homoscedasticity, Durbin-Watson test for non-independence of errors, and normality of residuals, also plotting the qq plot for studentized residuals and the plot of residuals against fitted values, with Tuckey test (to confirm normality of residuals).
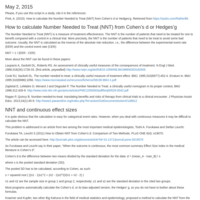
How to calculate the Number Needed to Treat (NNT) from Cohen's d or Hedges'g
A script in r to calculate number needed to treat (NNT), number needed to harm (NNH), likelihood of being helped or harmed (LHH) and the NNT from Cohen's d or Hedges'g
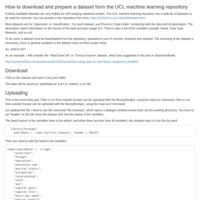
Preparing a dataset form the UCL machine learning repository
Instructions on how to prepare a dataset form the UCL machine learning repository, with some exploration of the “Adult Data Set” or “Census Income” dataset, including a machine learning model with the 'caret' package