
RobinLovelace
Robin Lovelace
Recently Published
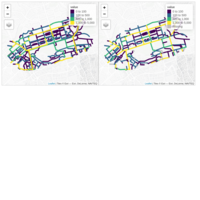
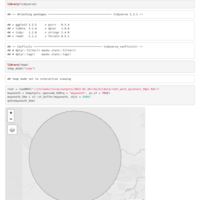
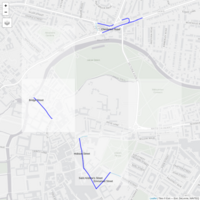
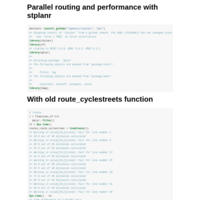
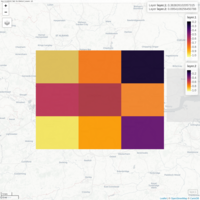
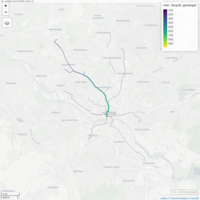
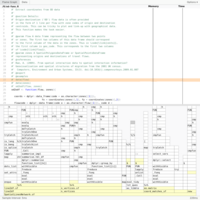
rnet_join() example
#' @examples
#' library(sf)
#' library(dplyr)
#' # Uncomment for interactive examples:
#' # library(mapview)
#' plot(route_network_small["flow"])
#' plot(osm_net_example$geometry, lwd = 5, col = "grey")
#' plot(route_network_small["flow"], add = TRUE)
#' rnetj = rnet_join(osm_net_example, route_network_small, dist = 9)
#' mapview(rnetj, zcol = "flow") +
#' mapview(route_network_small, zcol = "flow")
#' plot(rnetj["flow"])
#' plot(route_network_small["flow"], add = TRUE)
#' rnetj_summary = rnetj %>%
#' sf::st_drop_geometry() %>%
#' group_by(osm_id) %>%
#' summarise(
#' flow = weighted.mean(flow, length_y, na.rm = TRUE),
#' )
#' osm_joined_rnet = left_join(osm_net_example, rnetj_summary)
#' plot(osm_joined_rnet[c("flow", "highway")])
#' mapview(joined_network) +
#' mapview(route_network_small)


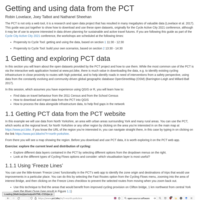
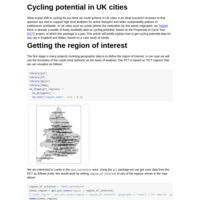
Getting and using data from the PCT
Marked-up version of https://itsleeds.github.io/pct/articles/getting.html


Active travel potential and planning
Slides for SSPA module at ITS Leeds
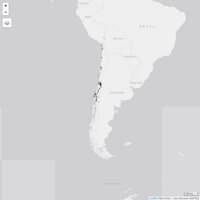
Walking and cycling levels in Chorlton, Manchester
From the 2011 Census via the PCT

Testing tabset feature in RMarkdown
https://github.com/rstudio/rmarkdown/issues/2053
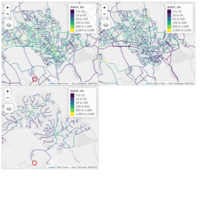
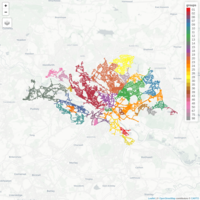
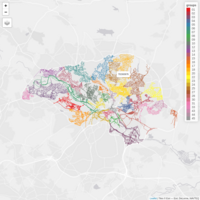
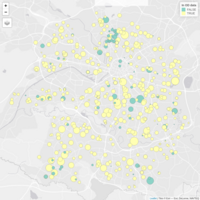
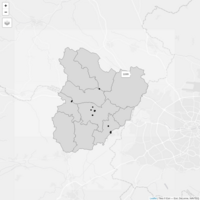
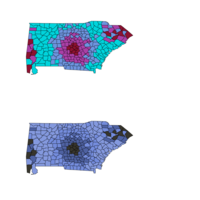
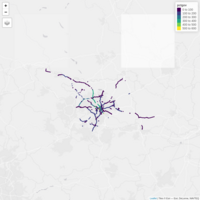
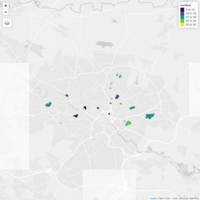
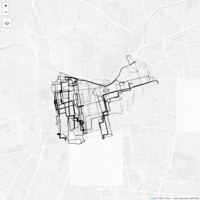
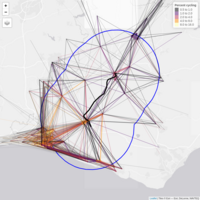
Clustering route networks - Leeds
See here for code: https://github.com/ropensci/stplanr/issues/442

Coursework update
For sspa module
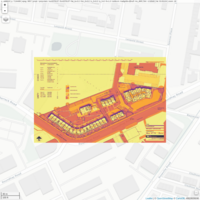
Historic map of Hereford MKII
See https://github.com/katyrobin/tithe-map-tiles
historic map - hereford
From 1910 - 1915 land use survey

LIDA location - interactive
See here: https://github.com/geocompr/geocompkg/blob/master/courses/2-day-course.Rmd
3d map - mapdeck
For biodar project

Accessibility slides
For sspa module
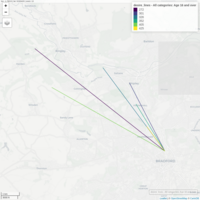
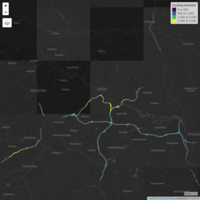
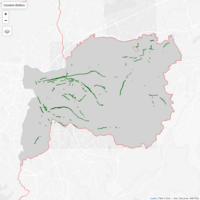
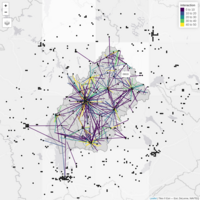
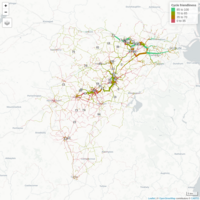
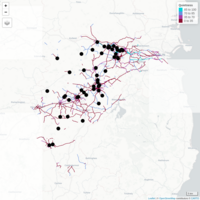
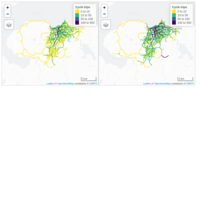
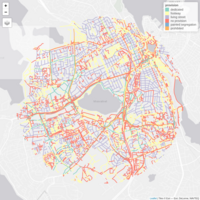
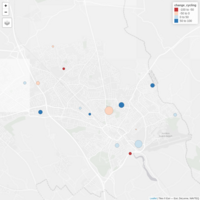
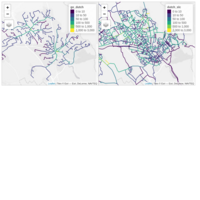
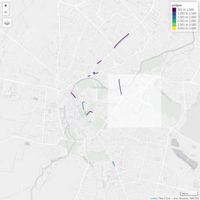
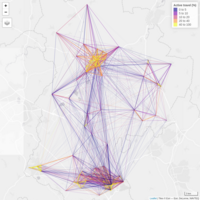
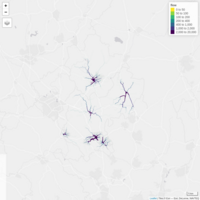
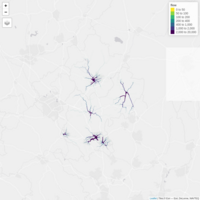
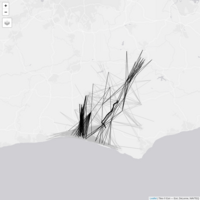
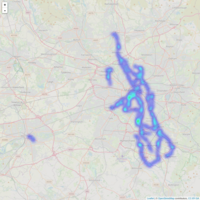
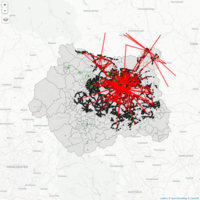
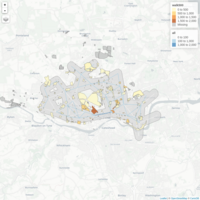
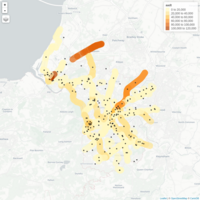
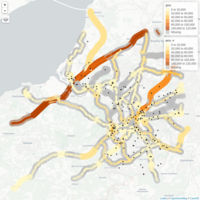
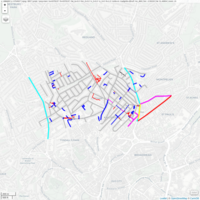
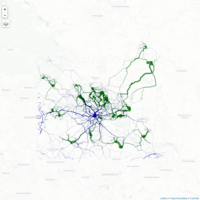
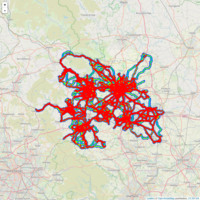
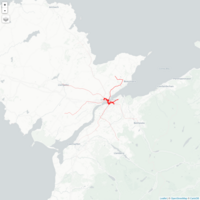
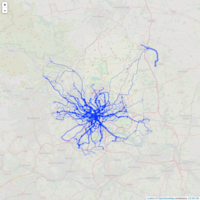
Car dependent desire lines in Greater Manchester
Code:
u = "https://github.com/npct/pct-outputs-regional-notR/raw/master/commute/msoa/west-yorkshire/l.geojson"
# u = "/mnt/27bfad9a-3474-4e61-9a43-0156ebc67d67/home/robin/npct/pct-outputs-regional-R/commute/msoa/greater-manchester/l.Rds"
# desire_lines = readRDS(u)
# desire_lines = sf::st_as_sf(desire_lines)
library(dplyr)
library(sf)
desire_lines_all = read_sf(u)
plot(desire_lines_all$geometry)
plot(cw, add = T, col = "green")
desire_lines_1000 = desire_lines %>%
top_n(1000, all)
car_dependent_routes = desire_lines_1000 %>%
mutate(percent_drive = car_driver / all * 100) %>%
filter(rf_dist_km < 3 & rf_dist_km > 1)
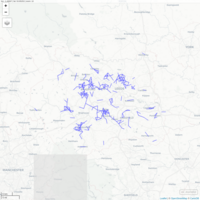
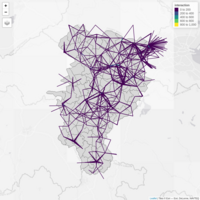
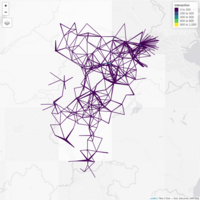
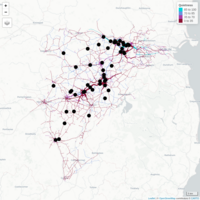
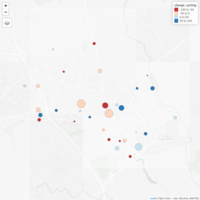
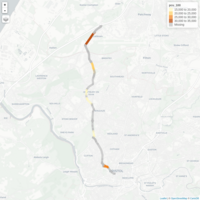
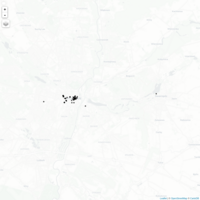
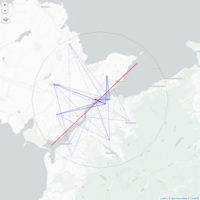
Car dependence in Leeds
library(sf)
library(tidyverse)
desire_lines = read_sf("https://github.com/npct/pct-outputs-regional-notR/raw/master/commute/msoa/west-yorkshire/l.geojson")
plot(desire_lines)
car_dependent = desire_lines %>%
filter(car_driver / all > 0.5 & rf_dist_km < 3)
mapview::mapview(car_dependent)

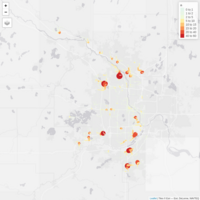
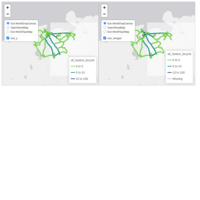
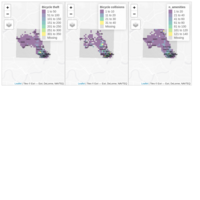
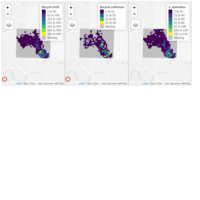
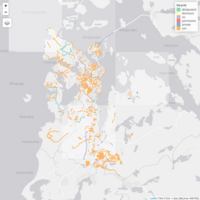
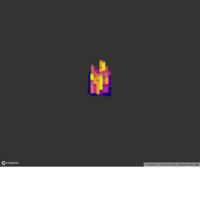
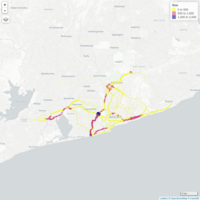
Cycle to bus stops potential to replace car trips - preliminary estimate for Minnesota
Input data: https://gisdata.mn.gov/dataset/us-mn-state-metc-society-tbi-transit-onboard2016
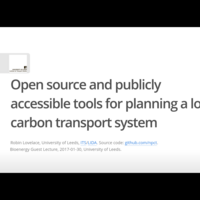
Open tools for investment - Presentation in Parliament
Presentation to the APPWG


Cabinet Office Open Innovation Team presentation
On PCT and CyIPT
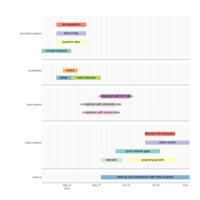
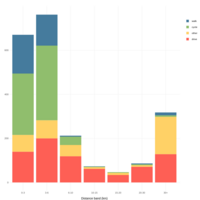
Gantt chart illustration made with vistime
See https://gist.github.com/Robinlovelace/ac4d1050c0446f6a3a4f8c55cfc79286 for reproducible code
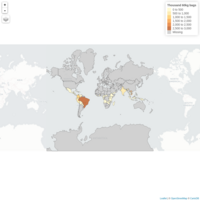
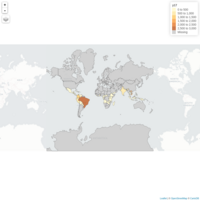
Global map of coffee production - geocompr book
How to make a map of global coffee production in less than 20 lines of code?
See here for details: http://geocompr.robinlovelace.net/attr.html#vector-attribute-joining
Global map of coffee production - geocompr book
How to make a map of global coffee production in less than 20 lines of code?
See here for details: http://geocompr.robinlovelace.net/attr.html#vector-attribute-joining

Can Spatial Modelling Save the world?
Talk for Sheffield's White Rose DTC taster event

Modelling the uptake of active travel: from infrastructure to behaviour change
Talk delivered at ITS Leeds
Isochrone map of time to Manchester airport
Generated with OTP thanks to code and tuition from Marcus Young

Computing Skills: Introduction to R
For the ITS Computer Skills course
Pedal, Park, Ride
For the TravelHackII
Go Dutch? Using open source software (R) to model sustainable transport (cycling)
Talk at UseR Northeast

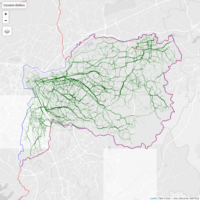
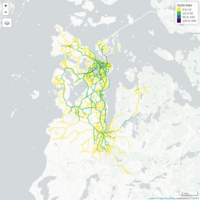
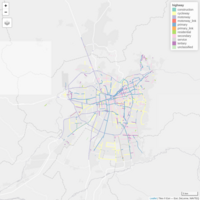
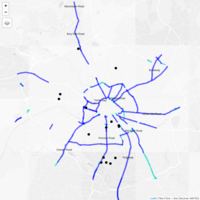
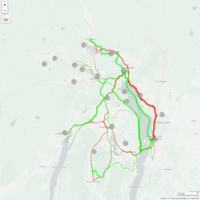
Cycle network Leeds - scenario from CyIPT
Generated by Malcolm Morgan and the CyIPT team at the University of Leeds

Implementing spatial interaction models: from prototype to globally scalable tools
Presented here: http://www.geog.leeds.ac.uk/ectqg17/home.html


Assessing the active travel impacts of major transport infrastructure projects
Slides presented at the RSAI conference, Harrogate, 2017-08-24: http://www.rsai-bis.org/

Scalable methods for modelling movement patterns
Slides presented at the Dagstuhl summer school
Activity-space example
Developed as for the 'team 1' challenge at the Dagstuhl summer school: https://www.dagstuhl.de/en/program/calendar/semhp/?semnr=17282


Assessing the Potential for Uptake of Cycling to School: A Case Study of England
Slides for Pecha Kucha session at the International Conference for Transport and Health


A global propensity to cycle tool?
Slides for a panel session at the Scientists for Cycling Colloquium, Nijmegen, 2017.
PCU estimates for Bristol
To feed into the Cycling Infrastructure Prioritisation Toolkit (CyIPT) project
Point pattern analysis of London Cycle Hire points
Based on code for the in-development geocompr book project: https://github.com/Robinlovelace/geocompr/blob/master/work-in-progress/10-point-pattern.Rmd
Pubs in Poznan
As part of a course I teach in this wonderful Polish city.
To reproduce this - see the source code here:
https://github.com/Robinlovelace/cs7/blob/master/basic-script.R#L175-L186


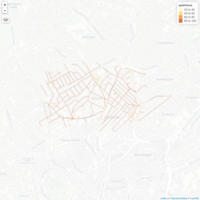
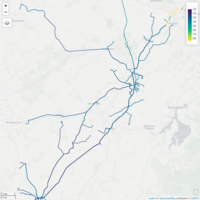
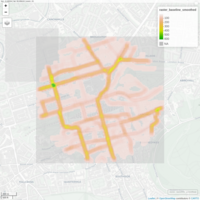
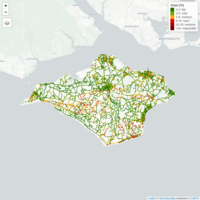
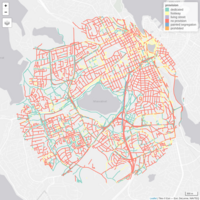
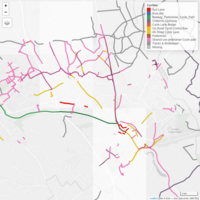
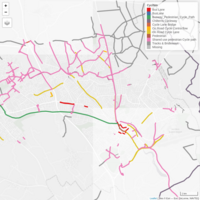
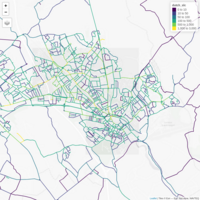
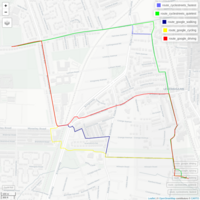
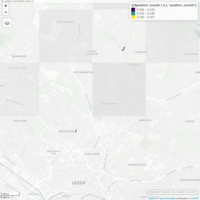
Quietness of osm lines
In Bristol - thanks to CycleStreets.net and omsdata
Isolated TfL cycle docking stations
From the Creating-maps-in-R tutorial
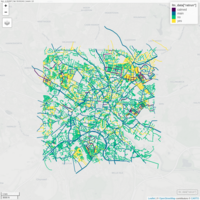
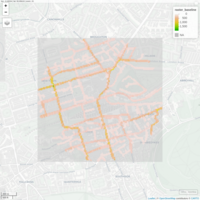
OSM cycleways in Bristol
Aim: fill the holes that are on the map but not in our data


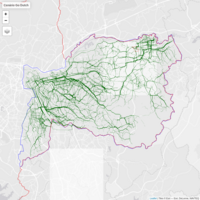
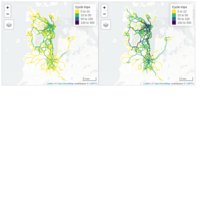
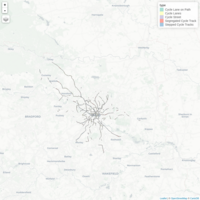
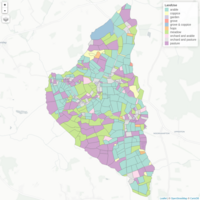
Overlay of cycle to school potential and cycle to work potential in Leeds
This is the Go Dutch scenario of the Propensity to Cycle Tool

Open source software for statistics and transport: a match made in heaven?
Talk for the Royal Statistical Society Bradford - see here for details: https://sites.google.com/site/rssleedsbradford/home/2016_2017_session/transport

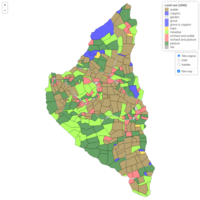
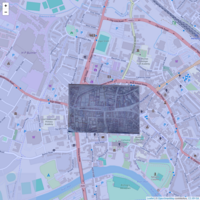
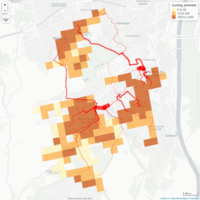
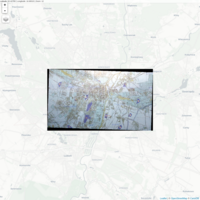
Norton Canon Tithe example III
With custom tileserver providing default basemap this time (not projected right, I know)
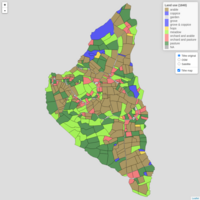
Norton Canon Tithe example II
Another example of plotting land-use data with R/leaflet. Reproducible code and data lives here: https://github.com/Robinlovelace/Creating-maps-in-R/blob/master/R/visualise-tithe-map-hereford.R
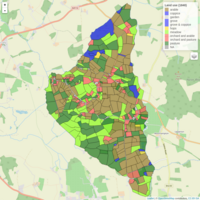
Norton Canon Tithe example
Example illustrating how to create a webmap with R/leaflet
Example of webgl using R's leaflet.extras package
Prototyping for the Propensity to Cycle Tool (PCT)

Methods for assessing the geographical distribution of cycling potential
Slides presented at the S4C colloquium in Aveiro, Portugal: https://scientistsforcyclingaveiro2016.wordpress.com/program/


Open source software for transport planning
UCL Seminar at CASA

stplanr: a package for transport planning
Slides presented at eRum 2016
Introduction to Spatial Data in R
Slides explaining how R stores spatial data with the sp package

Visualising spatial data with R: from base to shiny
Slides to accompany my teaching materials at the first European R Users Meeting (eRum): http://erum.ue.poznan.pl/#schedule
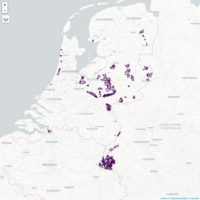
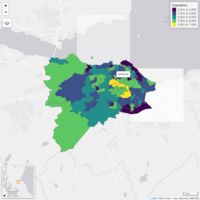
Hilly zones in The Netherlands
Administrative zones in Holland with an average gradient over 1%

Tools of the trade: adapting 20th century transport models for 21st century challenges
Presentation delivered at the 2016 Cycling and Society conference

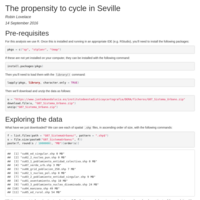
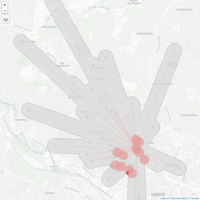
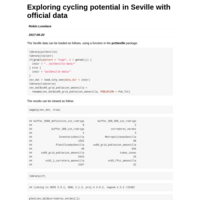
Basic methods for analysing cycling potential in Seville
Slides presented at the Universidad de Sevilla
GIS for Transport Workshop
Presented at the RGS-IBG annual conference
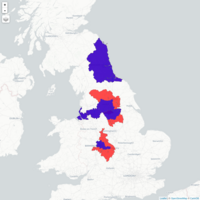
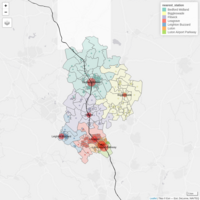
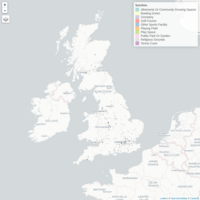
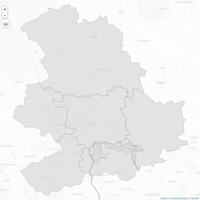
Combined Authorities and some LEPS in England
Data from https://data.gov.uk/dataset/combined-authorities-eng-jun-2016-boundaries-generalised-clipped and https://www.gov.uk/government/statistical-data-sets/local-enterprise-partnerships-leps-rural-urban-gis-shapefiles
Code: https://github.com/Robinlovelace/Creating-maps-in-R/commit/5ef4c528c9b4108a4fe9e645d2b02791559041e3

The propensity to cycle tool rail stations
Slides for presentation at Seamless Travel event: https://www.eventbrite.co.uk/e/seamless-integration-tickets-25803084721
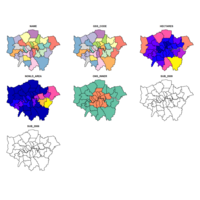
EU Referendum Results Map
Results from referendum, scraped from internet: https://github.com/Robinlovelace/Creating-maps-in-R/blob/master/R/brexit-map.R

The case for open source software in transport modelling
Slides presented at the Radical Transport Conference, UCL, 20th June 2016

Cycling and transport policy: embedding active travel in every stage of the planning process
Slides for my talk at the Hackney Cycling Conference
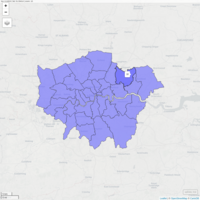
London % conservative vote
Demo of tmap in interactive mode
Intermediate and advanced R for spatial data
Slides linking together content for 2 day course on R for spatial data
The propensity to cycle tool: from conception to national deployment
Slides presented at the Cycle City Active conference in Leicester
Modelling cycling potential for sustainable transport planning: a case study of the Propensity to Cycle Tool
Slides presented at the University of Cardiff, 4th May 2016. More info - see http://www.cardiff.ac.uk/cplan/events/transport-seminar-series-tools-for-estimating-cycling-potential
Modelling and visualising Big Data for active travel: lessons from the PCT
Slides from our presentation at the Obesity Network: https://www.eventbrite.co.uk/e/obesity-network-seminar-data-methods-and-models-tickets-20890637459

Data analytics for health
Slides for the health hackathon 2016
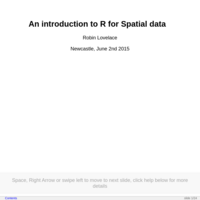
R for Spatial Data course slides
These slides accompany the 1 day course, An Introduction to R for Spatial Data.

Introduction to R and RStudio
Slides for a course teaching R and RStudio.


The Propensity to Cycle Tool: Software, design and uses
Slides providing an up-to-date overview of the open source strategic planning tool
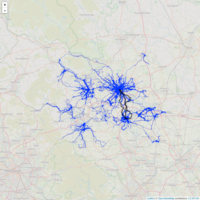
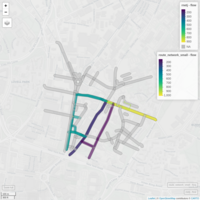
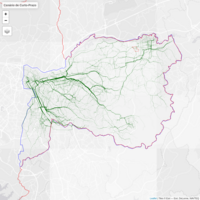
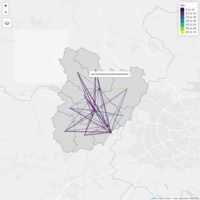
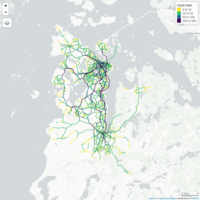
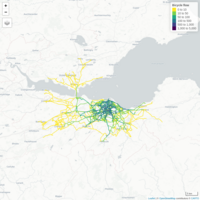
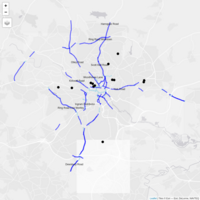
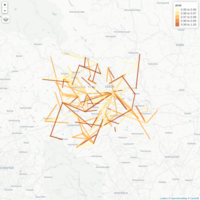
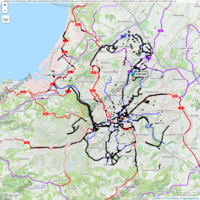
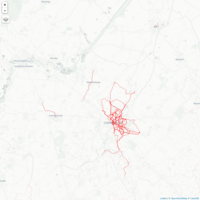
Route network - cyclists: Leeds
Output from the Propensity to Cycle project
The National Propensity to Cycle Tool - Cycling and Society conference
Slides with links from the Cycling in Society conference, Manchester 2015
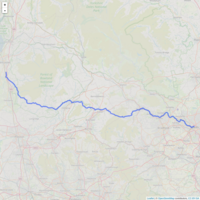
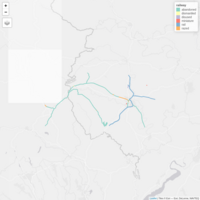
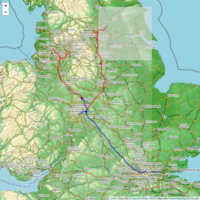
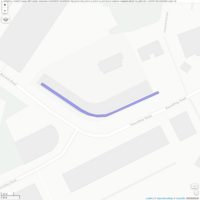
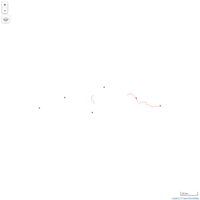
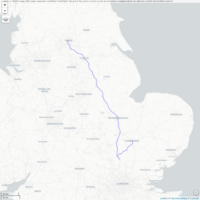
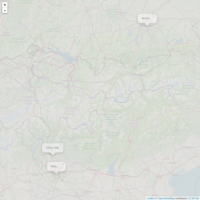
Lancaster to Leeds route
My trip back from GEOSTAT in Lancaster to my home in Leeds
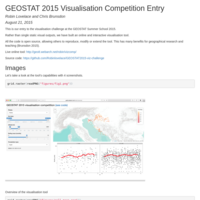
PCT: An open online planning tool for sustainable transport
My slides at the GEOSTAT summer school on the Propensity to Cycle Tool
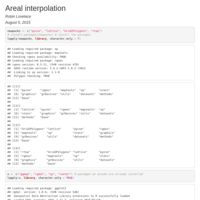
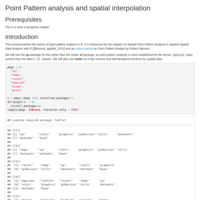
Spatial interpolation with R
Testing rtop and pycno packages for transfering data across different boundary shapes
Introduction to spatial data with R
Slides from the workshop in FOSS4G-E
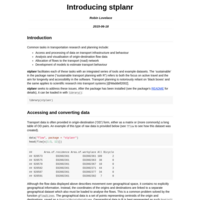
Introducing stplanr: a vignette
Vignette to accompany the stplanr package, available on github: https://github.com/Robinlovelace/stplanr
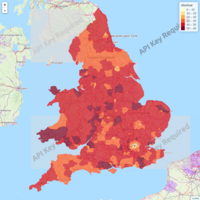
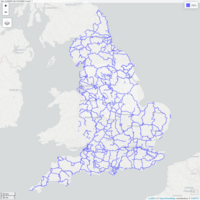
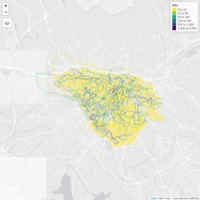
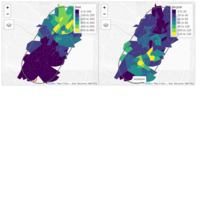
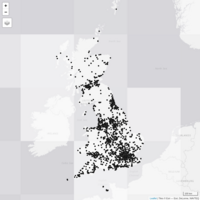
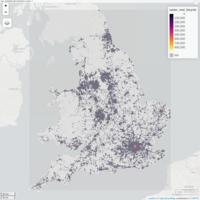
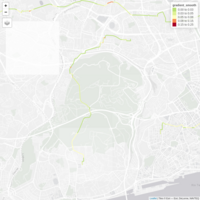
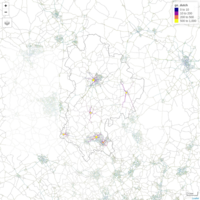
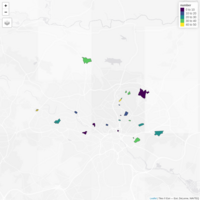
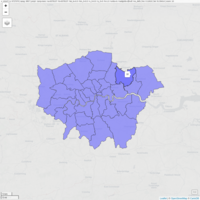
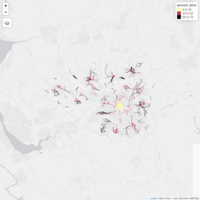
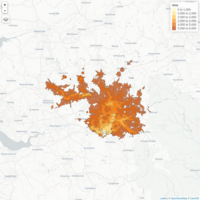
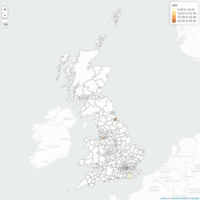
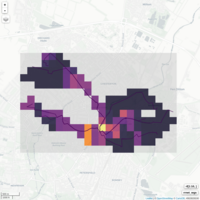
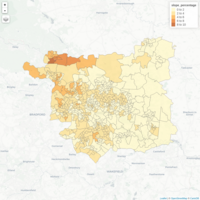
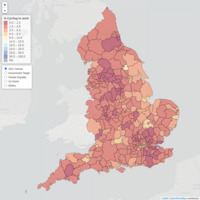
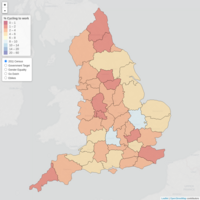
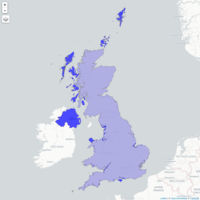
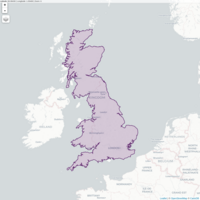
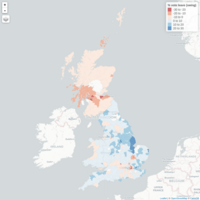
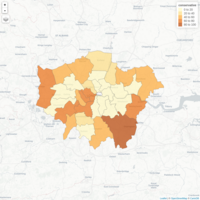
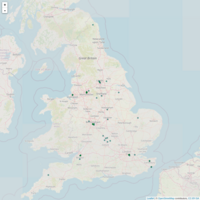
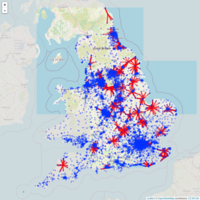
Percentage of commutes under 2km (Euclidean) by car in English and Welsh Local Authorities
This analysis demonstrates the high level of geographic variability in people's tendency to drive short distances across England and Wales. Across London boroughs, for example, less than 20% of very short commutes are made by car. In car-dominate commuter belts such as Bracknell, and rural areas potentially lacking quality public and active travel infrastructure, cars account for more than half of short journeys to work.
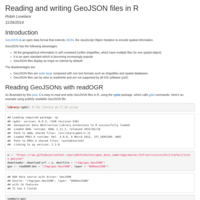
Multipart GeoJSON files in R
Related to https://github.com/Robinlovelace/Creating-maps-in-R
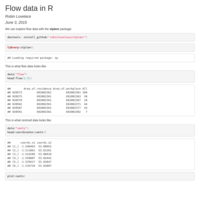
Flow data in R
Basic introduction to flow data in R
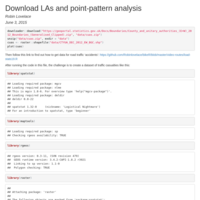
Download LAs and point-pattern analysis
Part of the Creating-maps-in-R tutorial
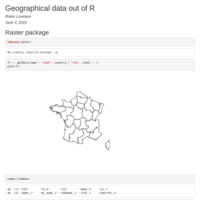
How to load and plot country-level data
Vignette from the Creating-maps-in-R tutorial

Popups of France from getData
From the Creating-maps-in-R vignette
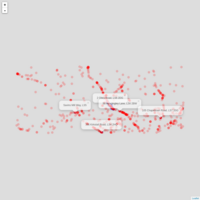
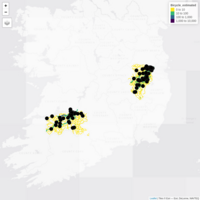
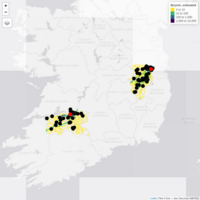
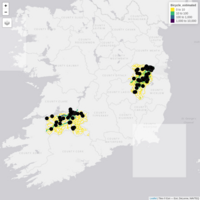
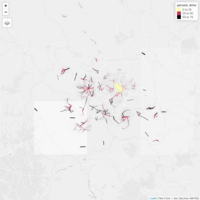
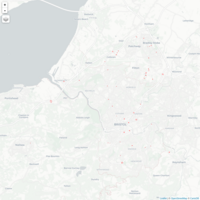
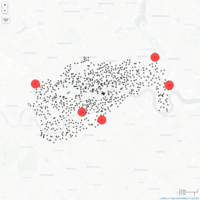
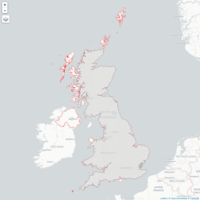
5 bicycle accident hotspots in Leeds
Preliminary results of research identifying some of the worst accident hotspots in Leeds for cycling.
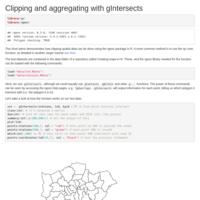
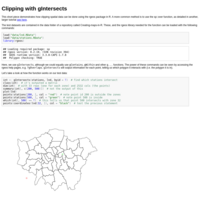
Clipping and aggregating with gIntersects
Using the power if the g* selection options for clipping and aggregating in R

Practical introduction to R
Slides for practical workshop in Girona

R for Spatial presentation
Slides to go with the popular tutorial, https://github.com/Robinlovelace/Creating-maps-in-R

Shiny for transport applications
Talk delivered at the University of Sydney's Institute of Transport and Logistics Studies (ITLS), 21st January 2015. This is in support of a workshop on learning shiny I delivered after the talk which is based on the free and open source learning-shiny tutorial I've developed: https://github.com/Robinlovelace/learning-shiny . Audio from the talk has been uploaded here: https://soundcloud.com/robin-lovelace-1/r-and-shiny-for-transport-applications

Systematic testing of methods for generating spatial microdata
Presented at the University of Wollongong, 19th Jan, 2015.

Lecture 1: Spatial microsimulation with R
Slides for NCRM Short Course in Cambrides, 18th - 19th September 2014

RSAI-BIS Presentation
Reproducibility in Regional Science
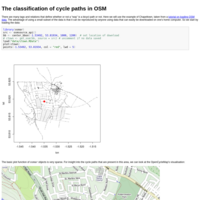
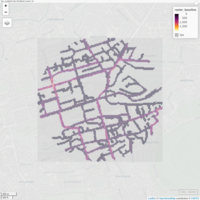
The classification of cycle paths in OSM
Small vignette of the many "ways" cycle paths are classified in Open Street Map (OSM) datasets.
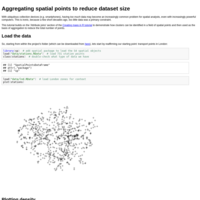
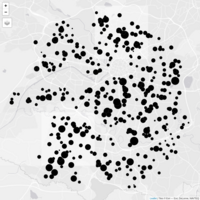
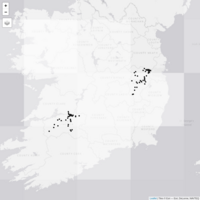
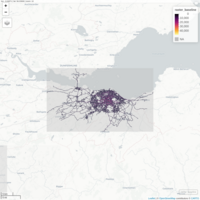
Aggregating spatial points to reduce dataset size
Spatial aggregation of points by clusters of high density.
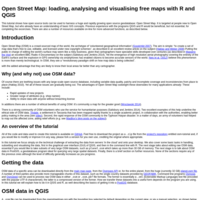
Open Street Map: loading, analysing and visualising free maps with R and QGIS
This tutorial discusses Open Street Map in general terms and describes how to analyse raw data using free software. The GitHub repository of this project can be found here https://github.com/Robinlovelace/osm-tutorial
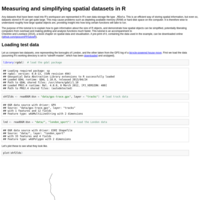
Measuring and simplifying spatial datasets in R
Miniature vignette to accompany Spatial Data Visualisation with R, an introductory book chapter on using R as a GIS - see preprint here: https://github.com/geocomPP/sdvwR

An introduction to R for visualising spatial data
Slides for an introductory course on using R - https://github.com/Robinlovelace/Creating-maps-in-R
Introduction to visualising spatial data in R
This is the updated version of tutorial on spatial data handling and visualisation in R, with a focus on ggplot2 graphics. The project repository can be found here: https://github.com/Robinlovelace/Creating-maps-in-R . This work took place as part of a Short Course funded by the Geo-spatial Data Analysis and Simulation (TALISMAN) node of the National Centre for Research Methods (NCRM), which took place in Leeds, January 24th 2014.
Clipping with gIntersects
Supplementary material to the Introduction to visualising spatial data in R tutorial: https://github.com/Robinlovelace/Creating-maps-in-R/blob/master/intro-spatial-rl.pdf
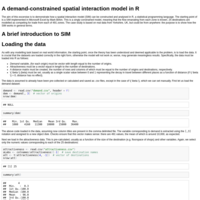
A demand-constrained spatial interaction model in R
Showcasing of the creation and analysis of a constrained spatial interaction model in R.
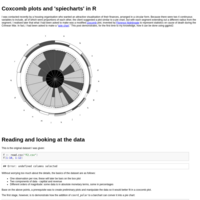
Coxcomb plots and 'spiecharts' in R
This was some fun I had trying to replicate Florence Nightingale's "Coxcomb plots" in ggplot and the more complex "spiecharts"
Some basic notes about the CO2 emissions of breathing and cycling
Estimates of the CO2 emissions of human respiration, with a focus on cycling.
Introduction to Spatial Data and ggplot2
An updated version of this tutorial on rpubs can be found here:
http://rpubs.com/RobinLovelace/11869
The document maintained at https://github.com/Robinlovelace/Creating-maps-in-R. Suggested improvements welcome.
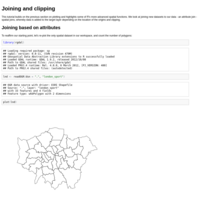
Joining and clipping
Joining and clipping spatial data using base R and ggplot 'esque' packages.
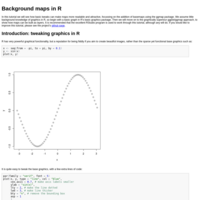
Background maps in R
Intro to ggmaps, with some background maps
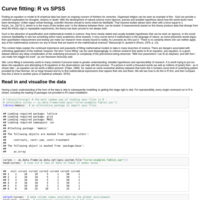
Curve fitting: R vs SPSS
Testing of R for curve fitting
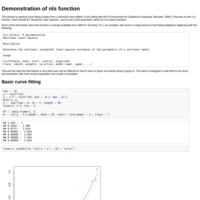
Demonstration of nls function
This is a basic introduction to the nls function, using a worked example modified from Rossiter's 2009 Curve fitting tuturial.
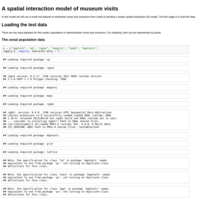
A spatial interaction model of museum visits
Testing of a SI model of visitor flows to museums in R
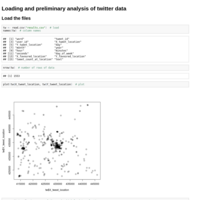
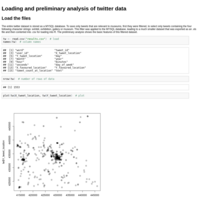
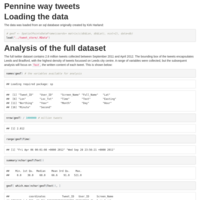
Loading and preliminary analysis of twitter data
Preliminary analysis of twitter data

Ratmog 11: Linear Programming
R implementation of Hay, A. M. (1977). Linear Programming: elementary geographical applications of the transportation problem. Geo Abstracts Limited.

Evaluating the performance of IPF
Presentation for RSAI-BIS, Cambridge, 2013
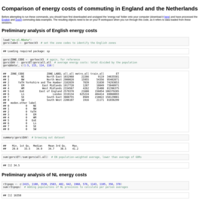
Comparison of energy costs of commuting in England and the Netherlands
This illustrates code used to compare the energy costs of commuting, calculated in my previous Rpubs uploads.
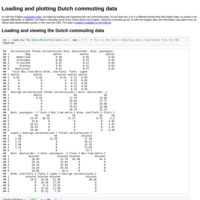
Loading and plotting Dutch commuting data
This script shows how to convert Dutch commuting data into energy costs, following-on from the English data (http://rpubs.com/RobinLovelace/7178 ). The raw data and code for this can be accessed here: https://dl.dropboxusercontent.com/u/15008199/egs2stay/energy-nat.zip
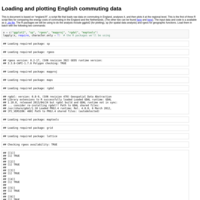
Loading and plotting english commuting data
Script illustrating how raw commuting data from the Census can be converted into energy costs for regions in England. To reproduce these results in their entirety, please download and extract the 'energy-nat' folder onto your computer and set this as your working directory in R: https://dl.dropboxusercontent.com/u/15008199/egs2stay/energy-nat.zip
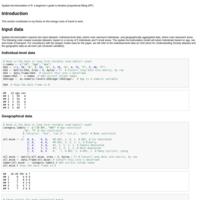
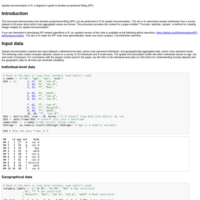
Spatial microsimulation in R: a beginner’s guide to iterative proportional fitting (IPF)
Practical introduction to the Iterative Proportional Fitting (IPF) algorithm in R.
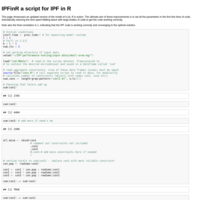
IPFinR a script for IPF in R
Shows an early version of the IPF script. The aim is to make it as generalised as possible; this is a step in that direction.
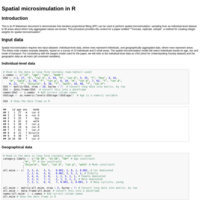
Spatial microsimulation in R
IPF code
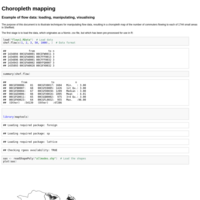
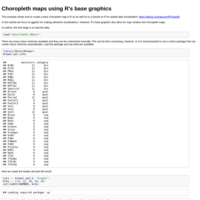
Choropleth mapping
Examples of chloropleth map plotting based on "long" type destination-origin flow data for Sheffield, using GISTools and ggplot2 packages