
Roeland-KINDT
Roeland Kindt
Recently Published

Extracting Whittaker biome types from a polygon modified from the plotbiomes package
Here I show to extract the Whittaker biome type from the position in environmental space defined by mean annual temperature and annual precipitation.
Using the BiodiversityR::treegoer.score() function and the Tree Globally Observed Environmental Ranges and ClimateForecasts databases to Filter GlobalUsefulNativeTrees outputs
The Tree Globally Observed Environmental Ranges (TreeGOER) database provides information for most known tree species of their environmental ranges for 38 bioclimatic, eight soil and three topographic variables. In this document, I show how outputs generated by the GlobalUsefulNativeTrees (GlobUNT) online database can be filtered to match bioclimatic conditions of the planting site. Bioclimatic conditions in historical (baseline) and future climates can be sourced from the ClimateForecasts database for 15,504 weather station locations.
Using WorldFlora to match GlobalTreeSearch version 1.7 with the latest database versions of World Flora Online and the World Checklist of Vascular Plants
Here I show scripts and results of matching the list of tree species of GlobalTreeSearch version 1.7 with the latest versions of the taxonomic backbone data sets of World Flora Online (version 2023.12) and the World Checklist of Vascular Plants (version 11).
Using the Tree Globally Observed Environmental Ranges and CitiesGOER databases to Filter GlobalUsefulNativeTrees Species Lists
This document shows how the Tree Globally Observed Environmental Ranges database and the CitiesGOER database can be used to filter lists of useful tree species obtained via the GlobalUsefulNativeTrees database.
Standardizing tree species names of GlobalTreeSearch with WorldFlora while testing the faster matching function of WFO.match.fuzzyjoin
Here I show how standardization of the GlobalTreeSearch names with World Flora Online or the World Checklist of Vascular Plants can be done more quickly via the new function of WorldFlora::WFO.match.fuzzyjoin. Using the new function comes with a cost of not being able to process larger data sets due to to memory size problems, but this problem can be relatively easily be circumvented by splitting the data in different data sets, as shown here. What I also show is how some of the manual checks after fuzzy matching was completed, such as accepting fuzzy matches for species names that only differ in ending as -a, -us or -um, or ignoring vowels.
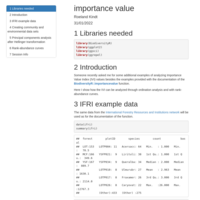
Analyzing Importance Value Index (IVI) via ordination analysis and rank-abundance curves
This document provides examples of analyzing importance value index values via ordination analysis and rank-abundance curves. These examples expand examples provided for the BiodiversityR::importancevalue and BiodiversityR::importancevalue.comp functions.

Species suitability modelling with BiodiversityR, raster and terra
The main objectives of this document were to:
(i) Showcase new options of BiodiversityR to work with the [terra package](https://rspatial.org/terra/index.html) (these options were introduced in version 14.1 of the package) and
(ii) Showcase some of the more recent methods for species distribution modelling pipelines that were introduced in [newer versions of BiodiversityR](https://cran.r-project.org/web/packages/BiodiversityR/ChangeLog) than the version that was described by [Kindt 2018](https://doi.org/10.1016/j.envsoft.2017.11.009). These newer methods include methods of spatial and environmental thinning, spatial folding and an *a posteriori* distance constraining method.
Another objective was to compare execution speeds between the **raster** and **terra** packages.
In addition, this document illustrates some of the methods used to create [a climate change atlas for Africa](https://atlas.worldagroforestry.org/).
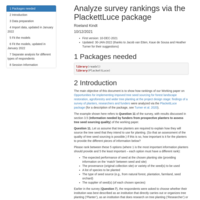
Analyze survey rankings via the PlackettLuce package
The publication shows how rankings of our Working paper on 'Opportunities for implementing impoved tree seed sourcing for forest landscape restoration, agroforestry and wider tree planting at the project design stage: Findings of a survey of planters, researchers and funders' (https://worldagroforestry.org/publication/opportunities-implementing-improved-tree-seed-sourcing-forest-landscape-restoration) were analyzed via the PlackettLuce package (Turner et al. 2020; https://doi.org/10.1007/s00180-020-00959-3). The example shown refers to Question 11 of the survey, with results discussed in section 3.5 ('Information needed by funders from prospective planters to assess tree seed sourcing quality') of the working paper.
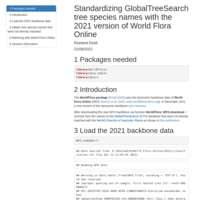
Standardizing GlobalTreeSearch tree species names with the 2021 version of World Flora Online
In a previous publication, species names from GlobalTreeSearch were standardized with the World Checklist of Vascular Plants. Here I re-check names that could not be matched directly
with the latest version (December 2021) of the World Flora Online taxonomic backbone.
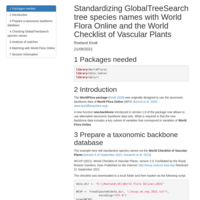
Standardizing GlobalTreeSearch tree species names with World Flora Online and the World Checklist of Vascular Plants
The document shows how the function of WorldFlora::new.backbone can create a backbone data set from the World Checklist of Vascular Plants that can consequently be used by matching functions of the WorldFlora package. An application is shown of checking tree species names from the GlobalTreeSearch list.
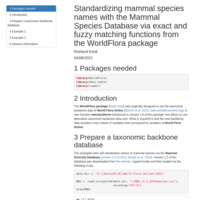
Standardizing mammal species names with the Mammal Species Database via exact and fuzzy matching functions from the WorldFlora package
Examples are given of using the new function of new.backbone to check mammal species names with the Mammal Diversity Database (https://www.mammaldiversity.org/).
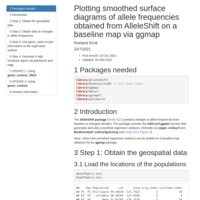
Plotting smoothed surface diagrams of allele frequencies obtained from AlleleShift on a baseline map via ggmap
The AlleleShift package (Kindt 2021; https://doi.org/10.7717/peerj.11534) predicts changes in allele frequencies from baseline to changed climates. The package includes the shift.surf.ggplot function that generates and plots smoothed regression surfaces, internally via vegan::ordisurf and BiodiversityR::ordisurfgrid.long (see Kindt 2021 Figure 5).
Here I show how smoothed regression surfaces can be plotted on a baseline map obtained via the ggmap package.
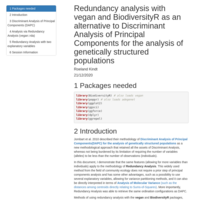
Redundancy analysis with vegan and BiodiversityR as an alternative to Discriminant Analysis of Principal Components for the analysis of genetically structured populations
Jombart et al. 2010 described their methodology of Discriminant Analysis of Principal Components(DAPC) for the analysis of genetically structured populations as a new methodological approach that retained all the assets of Discriminant Analysis, whereas not being burdened by its limitation of requiring the number of variables (alleles) to be less than the number of observations (individuals). In this document, I demonstrate that the same features (allowing for more variables than individuals) apply to the methodology of Redundancy Analysis. This widely used method from the field of community ecology does not require a prior step of principal components analysis and has some other advantages, such as a possibility to use several explanatory variables, allowing for variance partitioning methods, and it can also be directly interpreted in terms of Analysis of Molecular Variance (such as the distances among centroids directly relating to Sums-of-Squares). More importantly, Redundancy Analysis was able to retrieve the same ordination configurations as DAPC. Methods of using redundancy analysis with the vegan and BiodiversityR packages, including data preparation steps and publication-ready plotting methods via ggplot2, are shown here with the same simulated data sets that were used when introducing the DAPC method.
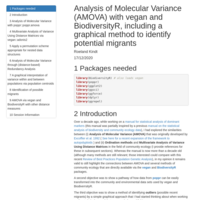
Analysis of Molecular Variance (AMOVA) with vegan and BiodiversityR, including a graphical method to identify potential migrants
This document has several objectives. One objective was to show how Sums-of-Squares that are calculated in the AMOVA procedure can also be obtained from Multivariate Analysis of Variance Using Distance Matrices and from (distance-based) redundancy analysis. I show how distances among centroids of populations and subpopulations correspond to Sums-of-Squares between populations and between samples within populations. I also make the case of using permutation tests that are appropriate for nested designs. Second and third objectives were to show how data from the poppr software can be transformed into community and environmental data sets that are used by vegan and Biodiversity (examples are given for haploid and diploid organisms); and to show how publication-quality ordination graphs can be produced via ggplot2. A fourth objective was to show a graphical method of detecting potential recent migrant individuals (or labelling errors) based on distances of individuals to population and subpopulation centroids.
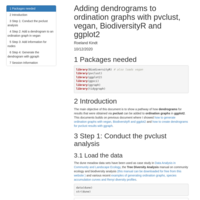
Adding dendrograms to ordination graphs with pvclust, vegan, BiodiversityR and ggplot2
The main objective of this document is to show a pathway of how dendrograms for results that were obtained via pvclust can be added to ordination graphs in ggplot2. This documents builds on previous documents where I showed how to generate ordination graphs with vegan, BiodiversityR and ggplot2 and how to create dendrograms for pvclust results with ggraph.
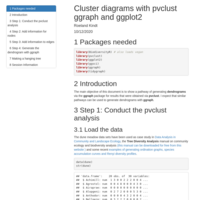
Cluster diagrams with pvclust and ggraph
The main objective of this document is to show a pathway of generating dendrograms via the ggraph package for results that were obtained via pvclust. I expect that similar pathways can be used to generate dendrograms with ggraph.
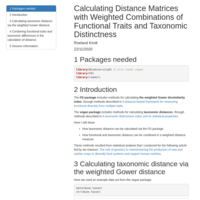
"Calculating Distance Matrices with Weighted Combinations of Functional Traits and Taxonomic Distinctness
Here I show how taxonomic distinctiveness as defined by Clarke and Warwick 2003 (URL https://doi.org/10.1046/j.1365-2664.1998.3540523.x) can be calculated via the FD:gowdis function instead of the vegan::taxa2dist function. It then becomes possible to combine functional traits and taxonomy in the calculation of distance matrices for different species (or other taxonomical levels).
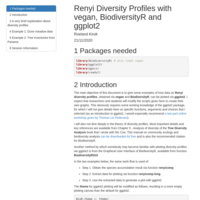
Renyi Diversity Profiles with vegan, BiodiversityR and ggplot2
The main objective of this document is to give some examples of how data on **Renyi diversity profiles**, obtained via **vegan** and **BiodiversityR**, can be plotted via **ggplot2**.
Species Accumulation Curves with vegan, BiodiversityR and ggplot2
The main objective of this document is to give some examples of how data on **species accumulation curves**, obtained via **vegan** and **BiodiversityR**, can be plotted via **ggplot2**.
Ordination graphs with vegan, BiodiversityR and ggplot2
The main objective of this document is to give some examples of how data from ordination, such non metric multidimensional scaling or redundancy analysis that were obtained via vegan and BiodiversityR, can be plotted via ggplot2. The key intermediate steps to allow plotting with ggplot2 is to get data in the ‘long’ (tidy) format that is used in ggplot2, which can be achieved with some functions in BiodiversityR that should work with most ordination results.