
Sergio_Garcia
Sergio Garcia
Recently Published
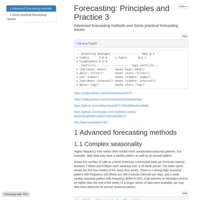
Principles and Practice 3: Part 5
Advanced forecasting methods and Some practical forecasting issues
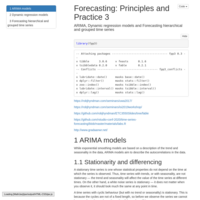
Principles and Practice 3: Part 4
ARIMA, Dynamic regression models and Forecasting hierarchical and grouped time series
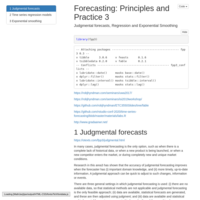
Principles and Practice 3: Part 3
Judgmental forecasts, Regression and Exponential Smoothing
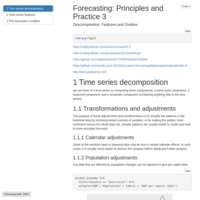
Forecasting: Principles and Practice 3: Part 2
Descomposition, Features and Toolbox
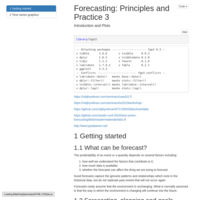
Forecasting: Principles and Practice 3: Part 1
Forecasting in R

Introduction to Shell
Introduction to Shell
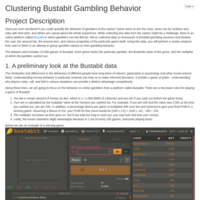
Clustering Bustabit Gambling Behavior
Have you ever wondered if you could quantify the behavior of gamblers at the casino?
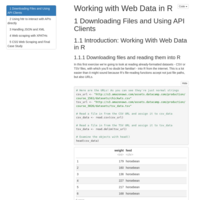
Working with Web Data in R
Working with Web Data in R
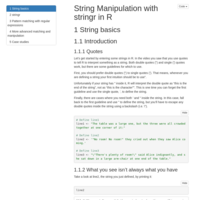
String Manipulation with stringr in R
String Manipulation with stringr in R
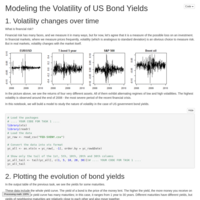
Modeling the Volatility of US Bond Yields
We will explore the volatility structure of US Government Bond Yields. Essentially all financial assets exhibit a phenomenon called volatility clustering where low and high volatility regimes follow each other.
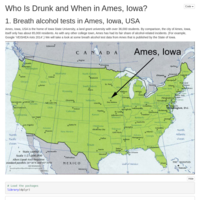
Who Is Drunk and When in Ames, Iowa?
"What is the highest recorded value?" and "When do breath alcohol tests occur most?"
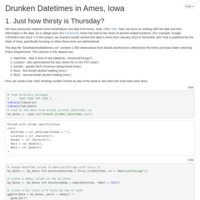
Drunken Datetimes in Ames, Iowa
In the Who Is Drunk and When in Ames, Iowa? project, you looked at breathalyzer test data from the State of Iowa. There was a lot of date-time manipulation that was hidden behind-the-scenes in that dataset. In this project, you will proceed to uncover temporal trends in the Ames breath alcohol data.
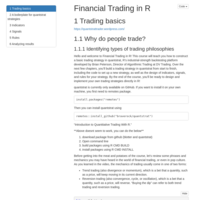
Financial Trading in R
Financial Trading in R
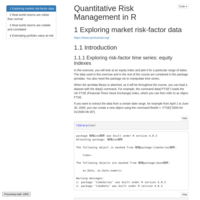
Quantitative Risk Management in R
Quantitative Risk Management in R
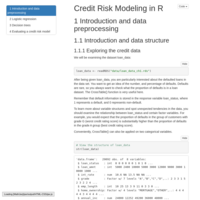
Credit Risk Modeling in R
Credit Risk Modeling in R
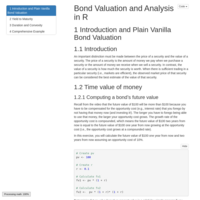
Bond Valuation and Analysis in R
Bond Valuation and Analysis in R
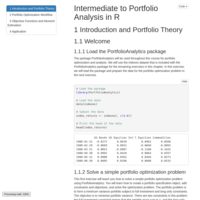
Intermediate to Portfolio Analysis in R
Intermediate to Portfolio Analysis in R
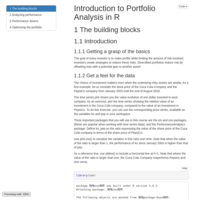
Introduction to Portfolio Analysis in R
Introduction to Portfolio Analysis in R
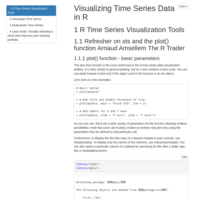
Visualizing Time Series Data in R
Visualizing Time Series Data in R
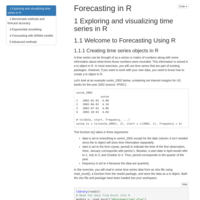
Forecasting in R
Forecasting in R
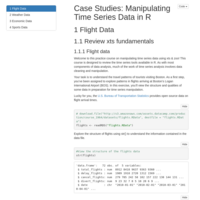
Case Studies: Manipulating Time Series Data in R
Case Studies: Manipulating Time Series Data in R
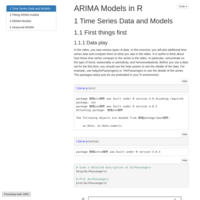
ARIMA Models in R
ARIMA Models in R
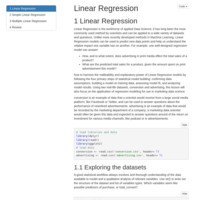
Linear Regression in R
Linear Regression module from Codecademy
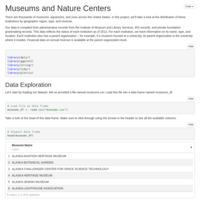
Museums and Nature Centers
Data visualization project in R
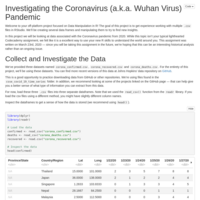
Investigating the Coronavirus (a.k.a. Wuhan Virus) Pandemic
Codecademy project
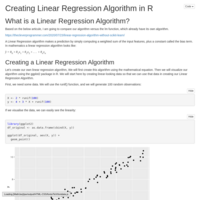
Creating Linear Regression Algorithm in R
Creating Linear Regression Algorithm in R
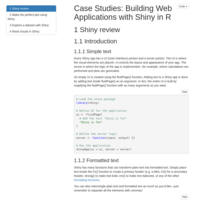
Case Studies: Building Web Applications with Shiny in R
Case Studies: Building Web Applications with Shiny in R
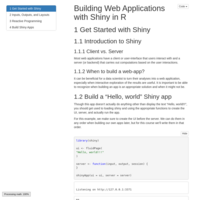
Building Web Applications with Shiny in R
Building Web Applications with Shiny in R
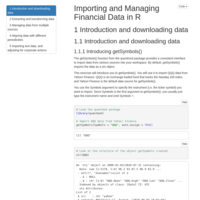
Importing and Managing Financial Data in R
Importing and Managing Financial Data in R
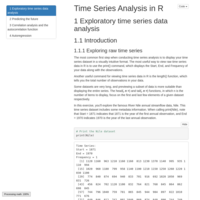
Time Series Analysis in R
Time Series Analysis in R
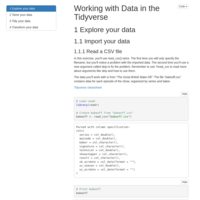
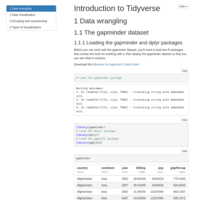
Working with Data in the Tidyverse
Working with Data in the Tidyverse
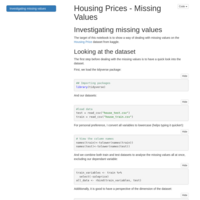
Housing Prices - Missing Values
Dealing with missing values on the Housing Price dataset from kaggle.
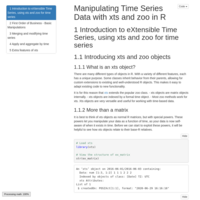
Manipulating Time Series Data with xts and zoo in R
Manipulating Time Series Data with xts and zoo in R
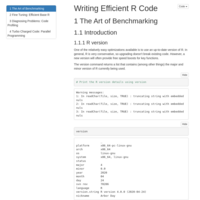
Writing Efficient R Code
Writing Efficient R Code
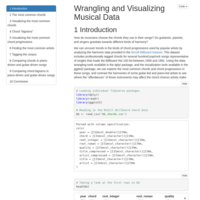
Wrangling and Visualizing Musical Data
Wrangling and Visualizing Musical Data
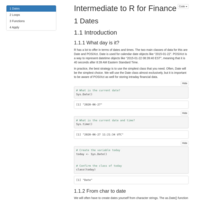
Intermediate to R for Finance
Intermediate to R for Finance
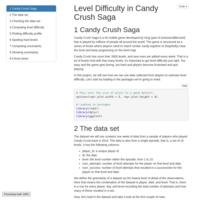
Level Difficulty in Candy Crush Saga
Data manipulation in R
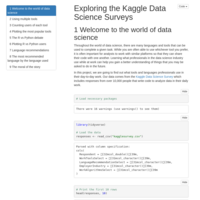
Exploring the Kaggle Data Science Surveys
Data analysis

Phyllotaxis: Draw Flowers Using Mathematics
Data visualisation in R
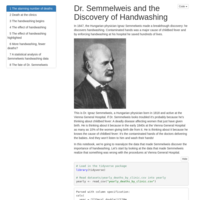
Dr. Semmelweis and the Discovery of Handwashing
Data manipulation in R
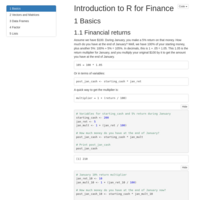
Introduction to R for Finance
Introduction to R for Finance
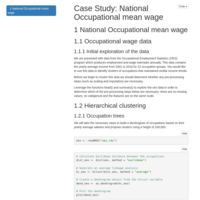
Case Study: National Occupational mean wage
Case Study: National Occupational mean wage
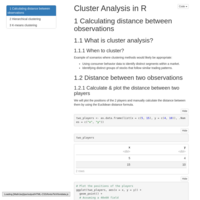
Cluster Analysis in R
Cluster Analysis in R
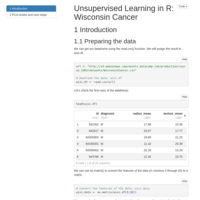
Wisconsin Cancer
Unsupervised Learning in R: Wisconsin Cancer
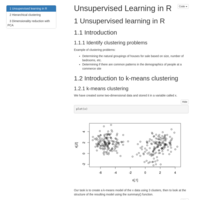
Unsupervised Learning in R
Unsupervised Learning in R
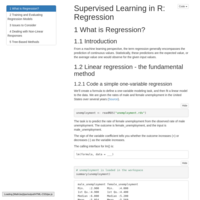
Supervised Learning in R: Regression
Supervised Learning in R: Regression
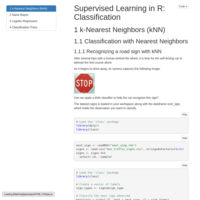
Supervised Learning in R: Classification
Supervised Learning in R: Classification
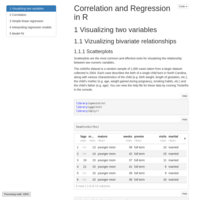
Correlation and Regression in R
Correlation and Regression in R
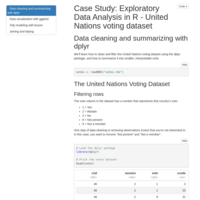
EDA: United Nations voting dataset
Case Study: Exploratory Data Analysis in R - United Nations voting dataset
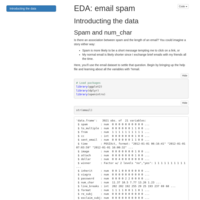
EDA: email spam
Example of Exploratory Data Analysis in R
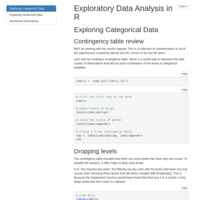
Exploratory Data Analysis in R
Exploratory Data Analysis in R
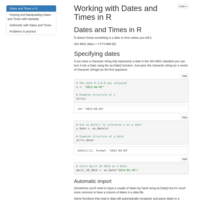
Working with Dates and Times in R
Working with Dates and Times in R
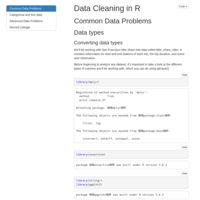
Data Cleaning in R
Data Cleaning in R
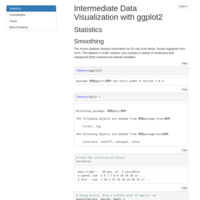
Intermediate Data Visualization with ggplot2
Intermediate Data Visualization with ggplot2
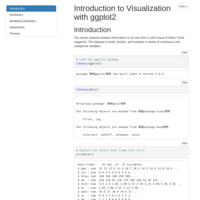
Introduction to Visualization with ggplot2
Introduction to Visualization with ggplot2 - Datacamp
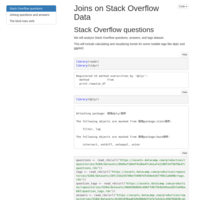
Joins on Stack Overflow Data
Using joins in R
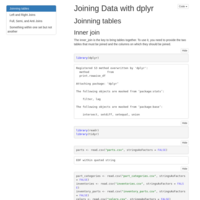
Joining Data with dplyr
Joining Data in R with dplyr library
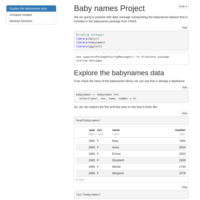
Baby names Project
Dplyr project in R
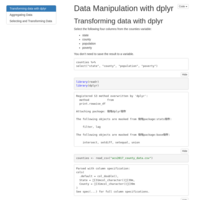
Data Manipulation with dplyr
Data Manipulation with dplyr in R
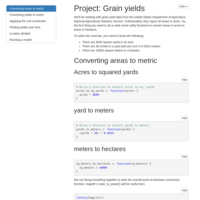
Project: Grain yields
Datacamp project in R. Using functions and creating a model.
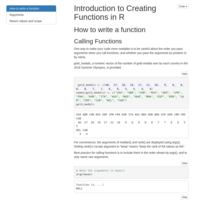
Introduction to Creating Functions in R
Functions in R
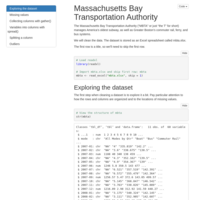
Data Cleaning: MBTA
Massachusetts Bay Transportation Authority: data cleaning exercise in R
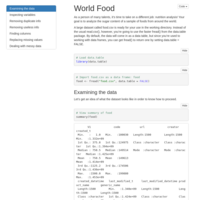
Data cleaning: World food
Data cleaning exercise in R
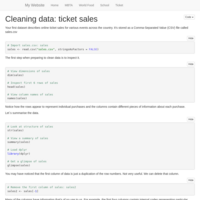
Cleaning Data in R: ticket sales
Example of cleaning data in R
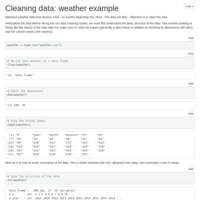
Cleaning data: weather example
Exercise of cleaning data in R
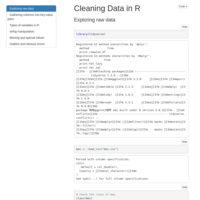
Cleaning Data in R
Cleaning Data using R
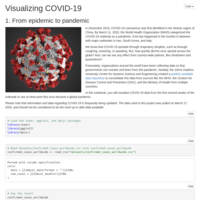
Visualizing COVID-19
DataCamp Project using some R data visualisation tools
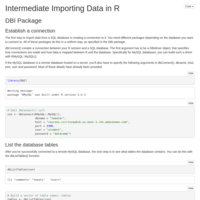
Intermediate Importing Data in R
Dealing with different types of data:
SQL, JSON, SAS, STATA, SPSS
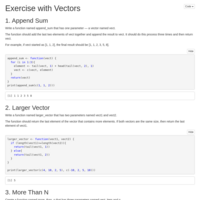
Exercise with Vectors in R
Exercise with Vectors using functions
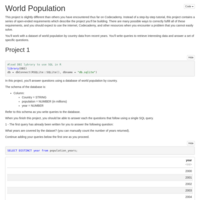
World Population - SQL project
Codecademy project in R studio
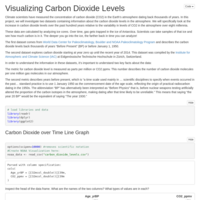
Visualizing Carbon Dioxide Levels
Practising R with Codecademy
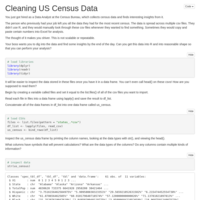
Cleaning US Census Data
R exercise: cleaning data