
Setegn
setegn
Recently Published


Document
Tilili line


Document
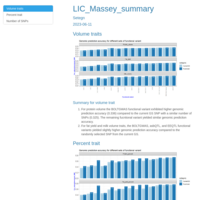
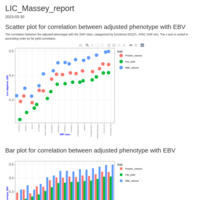
Kenya dairy data descriptive summary


Document
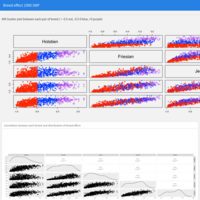
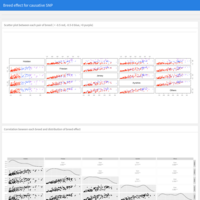
Breed issue


Document
Teaching Philosophy and Vision for the Future

Document
Multiomics model result


Document
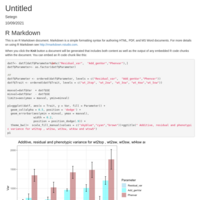
RNA_seq genomic prediciton

HTML
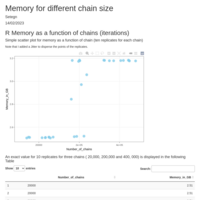
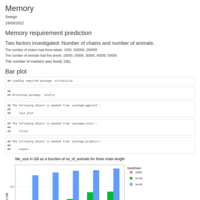
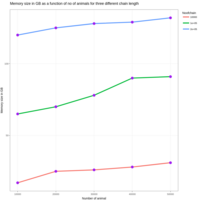
Predicting memory size to run real dataset
Document
Purebreed

Publish Document
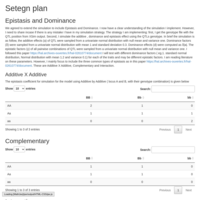
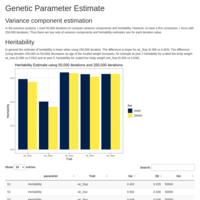
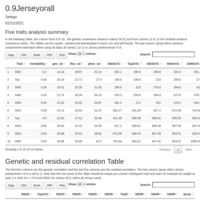
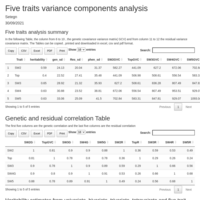
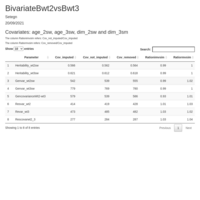
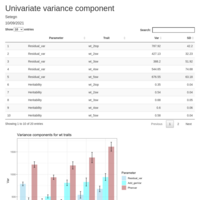
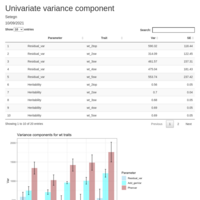
For this analysis, I used a starting value from the estimate obtained using five trait analyses.


Document
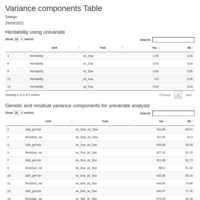
Univariate
Plot
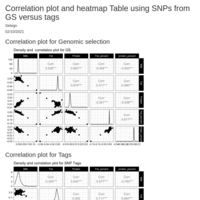
50KSNP

Publish Document
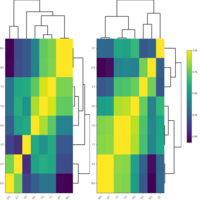
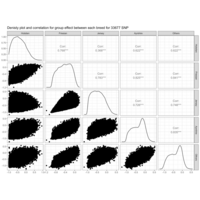
Densityplot
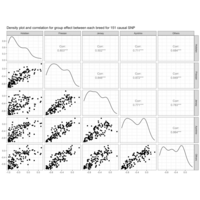
Plot
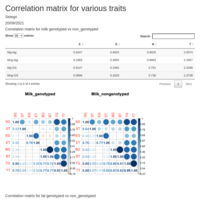
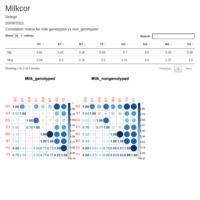
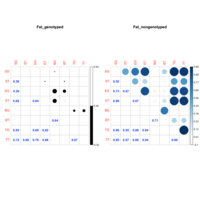
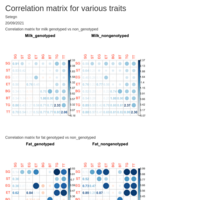
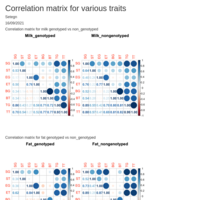
Density plot and correlation between each breed
Document
SNPchip
HTML
Accuracy
HTML
Bias_withgroupvswithnogroup
HTML
Imputemarker_geneticgroup
HTML
Climate data integration to Ethiopia on-Farm ACGG dataset
HTML
Climate data integration for Ethiopia on-farm ACGG
HTML
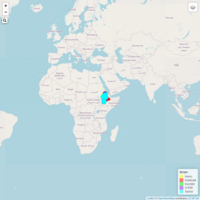
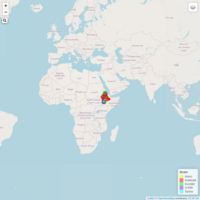
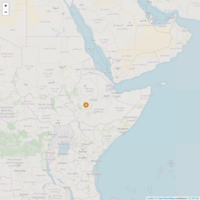
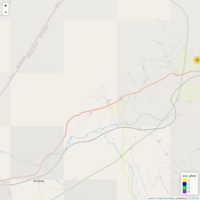
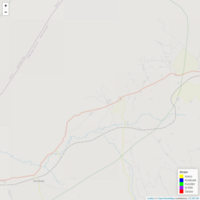
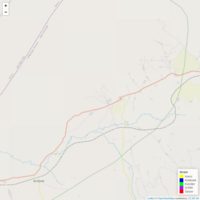
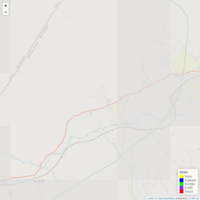
Map for three Location
HTML
Agro ecology classification based on phenotype
HTML
Weather data
HTML
Climatedata_ACGG
HTML
Climatedataintegration_ACGG
Document
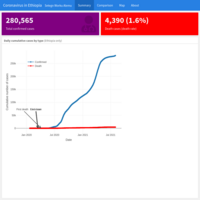
The Coronavirus Dashboard: the case of Ethiopia and its neighbors.
HTML
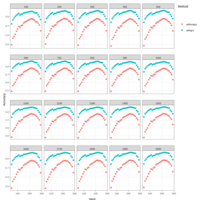
Animated plot for egg number per bird per week(epbpw) for Debrezeit station
HTML
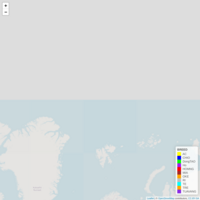
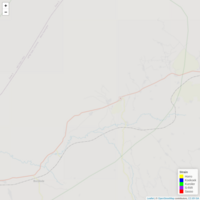
Map showing body weight of ACGG chickens in different region of Ethiopia.
It is clustered based on weight. By clinking to the lowest level we can see the specific weight in specific region for a specific breed