
Shaahin
Shahin Ashkiani
Recently Published
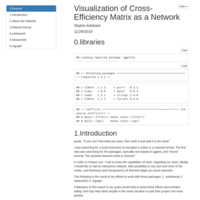
Visualization of Cross-Efficiency Matrix as a Network
Part of my working paper, regarding visualization of data envelopment analysis problems. A document to keep my efforts of using three different packages for network visualization in R.
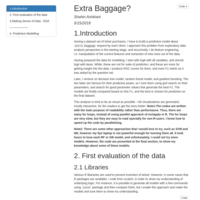
Extra Baggage? A Prediction Modelling on Airline Data
Using Logistic regression(Lasso), RandomForest, and Gradient Boosting, I predicted whether a customer would like to purchase extra baggage or not. The models are compared based on average AUC of 5folds 5repetitions cross-validation.
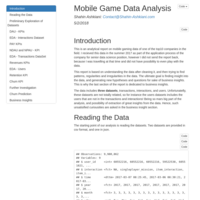
Analysis of a Mobile Game Dataset
Mobile gaming is a growing market with ~200b $ value. Data scientists are needed to work on the game data and extract valuable insights and actionable suggestions from them. In this report, I have analysed a set of three real datasets related to an anonymous game.
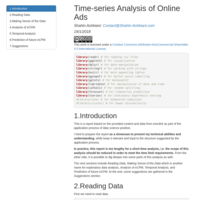
Time-Series Analysis of Online Ads
A comprehensive approach to a dataset of 100,000 records of 71 companies, their ad types, the impressions and costs of the ads. EDA + time-series analysis

Class Imbalance Problem - Part3
In this part, a new approach is used to tackle the problem. First, the training dataset is clustered using PAM, then a logistic regression model is fitted in each cluster. Using test data, this new approach shows huge advantage over the previous methods.
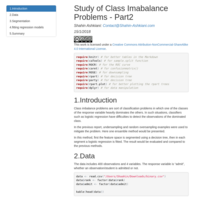
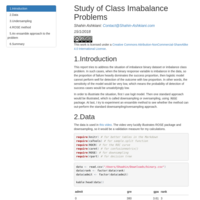
Class Imbalance Problem - Part 2
In this part of the study, I have tried to improve classification by fitting logit models to each segment of the feature space. The segmentation is done using decision tree method. The result is poor.
Class Imbalance Problems - Part I
Class Imbalance Problems are the classification problems where the frequencies of the response variable classes are not balanced. In such situations one class over-shadows the other, and being so makes it difficult for classifiers such as logistic regression to detect the dominated class observations. This study has two parts and this report is the part one. In this report, under sampling and ROSE methods are compared to logistic regression.
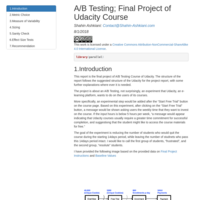
A/B Testing - Udacity Course Final Project
A/B Testing is a very common sort of experimental design and analysis in digital world. The method is used in order to check the effect of changes before implementations, and it is vital in optimisation of websites, online games, etc...

Bi-gram, tri-gram and word network analysis
The third part of text analysis of medical forum posts related to anxiety disorder. In this analysis, I have used bi-grams and trigrams analyses. Moreover, bi-gram networks are presented to give a more holistic perspective of the text
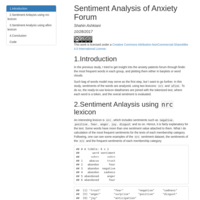
Sentiment Analysis of a Medical Forum
A medical forum about anxiety is used for performing sentiment analysis using nrc and afinn lexicons.
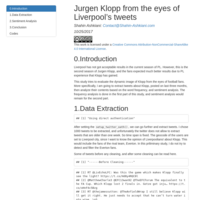
Sentiment Analysis of tweets about Klopp
Jurgen Klopp is one of my favourite managers. Probably the most favourite. However, he has not recently gotten any good result by Liverpool FC. This study is a text analysis, including word frequency and sentiment analysis, of 1000 tweets about Klopp, sent from Liverpool City.

How To Cope With Anxiety? : A Text Analysis Study
The data is from a medical forum, and is scraped using R. About 500 posts regarding the experience of members to deal with anxiety are analysed using Word frequency. The Word clouds reveal some interesting points

Visual Exploration of CO2 Emission of Copenhagen
Denmark Open Data website has various datasets, including a small dataset about CO2 emission in Copenhagen. The visualisations in the original spreadsheet were very limited, so I decided to do some further visual exploration into the data, using PCA bi-plots and time-series. The new plots revealed some hidden insights.
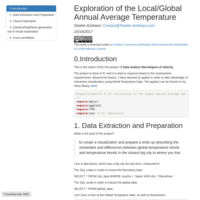
Exploration of Local/Global Average Annual Temperature
This is a report about comparison of Barcelona's annual average temperature and world's average. However, there is a link to a Shiny Applet that is generalisation of this report, and can be used for further exploration among various cities and different time periods.
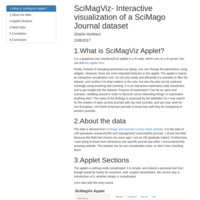
SciMagViz: Interactive visualization of a SciMago Journal dataset
Scientometric has been an interesting topic to me since 2011, when I first introduced to it and did my MSc dissertation on citation analysis.
This report is an introduction the a Shiny applet that I have recently developed in response to a personal curiosity about the performance of the open access journals.
The applet at the current level has filtering features for the data, and relatively comprehensive features for visualisation based on Bi-plot and MDS.
The GitHub repo and the applet address are available inside the report.
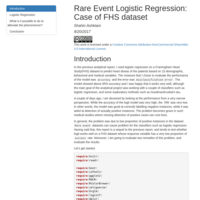
Rare Event dataset: logistic regression, Firth's logit and downsampling
I was happy that the logit model has 85% accuracy! However, the accuracy in isolation means almost nothing! The truth about the logit model revealed by checking TPR...
When the proportion of the success is very low in the dataset, we have the rare event phenomenon. But what to do with it? This report tends to check some remedies, after investigation of the problem.
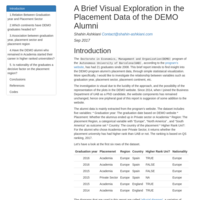
Exploration of DEMO's Alumni data using Alluvial Diagram
DEMO(Doctorate in Economics, Management and Organisation) is one of the PhD programs at Business Department's of Autonomous University of Barcelona(UAB).
This report is a concise visual investigation of DEMO's alumni data, regarding their placements after graduation.
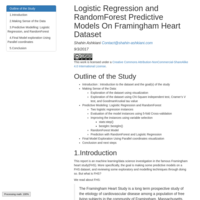
Predictive Analytics on Framingham Dataset
A Study on a dataset of 4240 cases of Framingham Heart Study centre, in order to build predictive models, using Logistic regression and Random Forrest. The evaluation is done using 5-Fold Cross Validation.
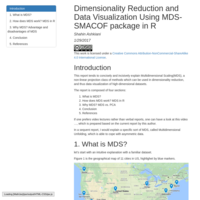
Data Visualisation Using Multidimensional Scaling
This publication is the first part of a series on Multidimensional Scaling and Unfolding that I am going to publish in Rpubs. It is A practical introduction to SMACOF package and Multidimensional Scaling, a dimension reduction and data visualisation technique. As I explained in the text, it intends to fill the gap between too short reports on MDS, available on web, and comprehensive textbooks such as (Borg and Groenen,2005). I did my best to make this instruction concise, incisive and accurate.

R-Movies: Rise and Fall
Ratio of R-rated movies to all the movies produced the same year is calculated for each decade from 70s to 2010s, based on a small dataset of 650 titles. The significance of differences between consecutive proportions are evaluated.
This report is a hobby job, from the hobby mini-projects that I have done and I do for fun, as well as practice statistics. Any critical appraisal on technical and non-technical aspects is welcomed.