
SmilodonCub
Bonnie Cooper
Recently Published
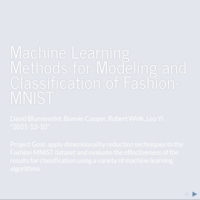
Data622 Final Report Summary Presentation
summary presentation slides for final report for Data622. We explored dimensionality reduction for the Fashion-MNIST dataset
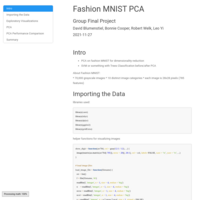
Fashion MNIST PCA
my PCA dimensionality reduction of Fashion MNIST. Section for DATA622 final report, a group project
DATA622 hw4
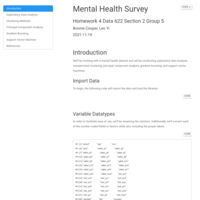
Mental Health Survey
Data 622 hw3
Group homework assignment
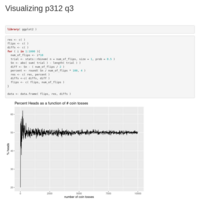
Data608 HW1
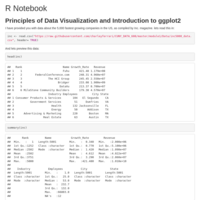
Principles of Data Visualization and Introduction to ggplot2
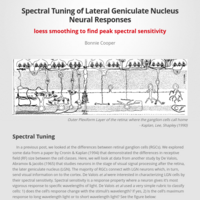
Spectral Tuning of LGN Responses
another loess smoothing application.
smoothed responses on LGN neurons to stimuli with different wavelengths of light
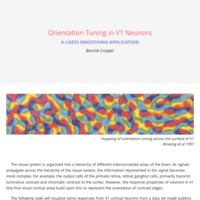
Orientation tuning in V1 Neurons
a loess smoothing application.
smoothed response histograms to different orientations are visualized to demonstrate tuning properties for V1 neurons

Retinal Ganglion Cell classes
using linear regression to demonstrate a physiological difference between retinal gagnlion cell classes using a classic data set

Build Wireframes & Lo-fi Prototypes
Notes from Google UX Design: Course 3
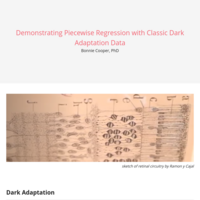
Dark Adaptation
Modelling the time course of dark adaptation with a classic psychophysics dataset.
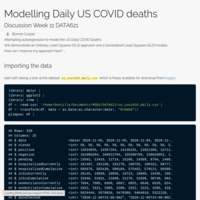
Modelling Daily US COVID deaths
autoregression, OLS (lm) and GLS methods in R

UX Design Process: Empathize, Define, and Ideate
Notes from Google UX Design: Course 2

Foundations of UX Design
Notes from Google UX Design: Course 1
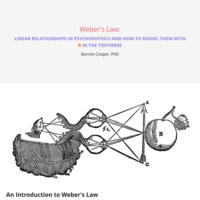
Weber's Law
Linear Relationships in Psychophysics and how to Model them with `R` in the tidyverse
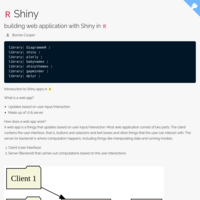
Building web apps with shiny in R
Notes from videos and exercises for DataCamp's Shiny Fundamentals with R. This is a casual follow along to help me remember all the things and to serve as future reference.
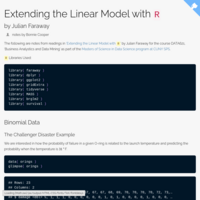
Extending the Linear Model with R
notes from readings in ‘Extending the Linear Model with R’ by Julian Faraway for the course DATA621, ‘Business Analystics and Data Mining’ as part of the Masters of Science in Data Science program at CUNY SPS.
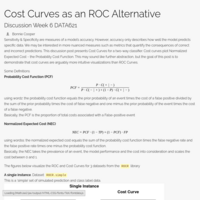
Cost Curves as an ROC Alternative
an quick introduction to cost curves as an alternative to ROC curves. for data621 discussion.
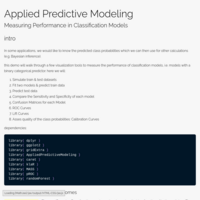
Performance of 2-Way Classifiers
notes for applied predictive modeling

Imputation with simputation & filling in the gaps
a short discussion post to facilitate dealing with missing values, imputation and understanding why imputation with regression is better than to the mean
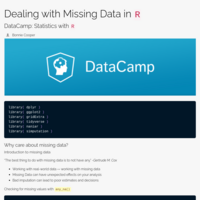
Dealing with Missing Data in R
Notes from videos and exercises for DataCamp's Statistics with R track. This is a casual follow along to help me remember all the things and to serve as future reference.
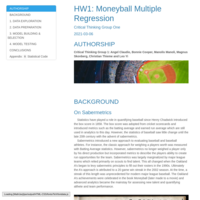
Sabertrics inspired multiple linear regression
Group miniproject for Business Analytics & Data Mining class.
Bayesian Modeling with RJAGS
Notes from videos and exercises for DataCamp's Statistics with R track. This is a casual follow along to help me remember all the things and to serve as future reference.
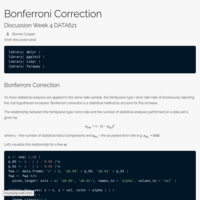
Bonferroni Correction
a short discussion post to demonstrate Bonferroni Correction
Inference for Categorical Data in R
Notes from videos and exercises for DataCamp's Statistics with R track. This is a casual follow along to help me remember all the things and to serve as future reference.
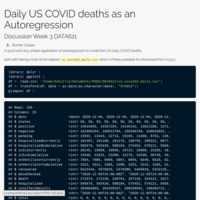
Autoregression of daily US COVID deaths
using simple sample code from LMR section 4.3 (Autoregression) to capture the weekly variation in US COVID deaths
Linear Algebra for Data Science in R
Notes from videos and exercises for DataCamp's Statistics with R track. This is a casual follow along to help me remember all the things and to serve as future reference.
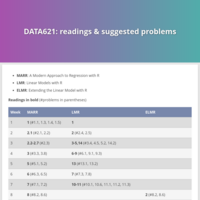
DATA621 Readings
useful table with reading & suggested problem assignments for DATA621: Business Analystics and Data Mining

Fundamentals of Bayesian Data Analysis in `R`
Notes from videos and exercises for DataCamp's Statistics with R track. This is a casual follow along to help me remember all the things and to serve as future reference.
A Modern Approach to Regressio with R
Notes and some finished problems fro 'A Modern Approach to Regression with R' by Simon Sheather
Linear Models with R
Notes and some finished problems fro 'Linear Model with R' by Julian Faraway

Intro2PsychophysicalMethods
presentation to accompany prosem lecture w/ jupyter lab notebook

photometry
pre to accompany prosem lecture w/ jupyter lab notebook
A/B Testing in R
Notes from videos and exercises for DataCamp's Statistics with R track. This is a casual follow along to help me remember all the things and to serve as future reference.
Experimental Design in R
Notes from videos and exercises for DataCamp's Statistics with R track. This is a casual follow along to help me remember all the things and to serve as future reference.
Dealing with Missing Data in R
Notes from videos and exercises for DataCamp's Statistics with R track. This is a casual follow along to help me remember all the things and to serve as future reference.
Foundations of Probability in R
Notes from videos and exercises for DataCamp's Statistics with R track. This is a casual follow along to help me remember all the things and to serve as future reference.
Foundation of Inference
Notes from videos and exercises for DataCamp's Statistics with R track. This is a casual follow along to help me remember all the things and to serve as future reference.
Multiple and Logistic Regression in R
Notes from videos and exercises for DataCamp's Statistics with R track. This is a casual follow along to help me remember all the things and to serve as future reference.
Correlation and Regression in R
Notes from videos and exercises for DataCamp's Statistics with R track. This is a casual follow along to help me remember all the things and to serve as future reference.
Modeling with Data in the Tidyverse
Notes from videos and exercises for DataCamp's Statistics with R track. This is a casual follow along to help me remember all the things and to serve as future reference.
Exploratory Data Analysis in R
Notes from videos and exercises for DataCamp's Statistics with R track. This is a casual follow along to help me remember all the things and to serve as future reference.
Introduction to Data in R
Note from videos and exercises for DataCamp's Statistics with R track. This is a casual follow along to help me remember all the things and to serve as future reference.
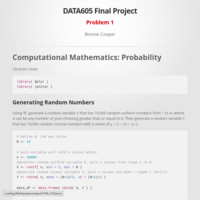
DATA605 Final Exam Problem1
Probability problem set
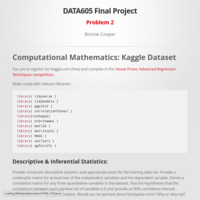
DATA605 Final Exam Problem2
kaggle housing dataset
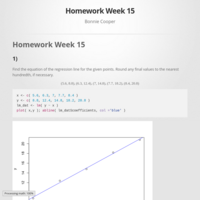
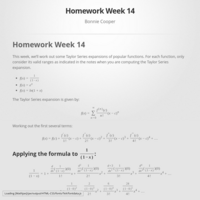
DATA605 HW #14
Taylor Series Expansions
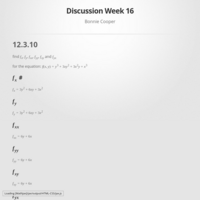
Discussion Week16
Partial DiffyQs
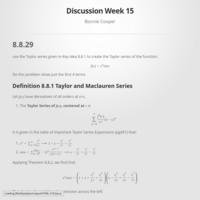
Discussion Week16
Taylor Series Expansion

Discussion Week 4
Simple calculus: find area bounded by two functions

DATA605 HW #13
messin around with some calculus problems
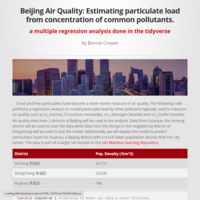
Beijing Air Quality
linear multiple regression to estimate fine particulates by pollutants concentrations and meteorological data.
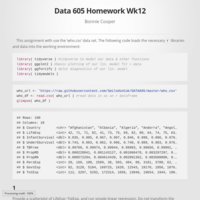
DATA605 HW #12
linear regressions homework tasks with WHO data
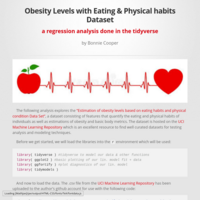
Simple Multiple Linear Regression
uses the dataset: "Estimation of obesity levels based on eating habits and physical condition Data Set" to find eating habits and other parameters predictive of BMI
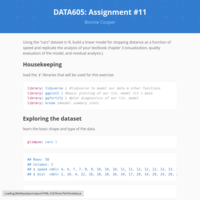
DATA605 HW #11
simply simple linear regression + diagnostics
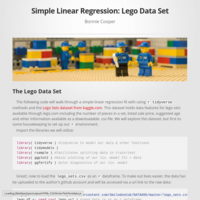
Lego Linear Regression
just a simple linear regression using the lego set datast from kaggle
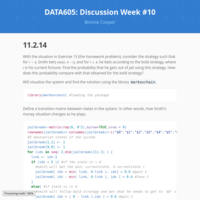
Discussion Week10
Absorbing Markov Chain
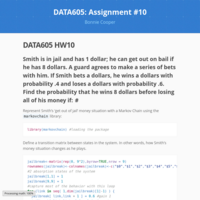
DATA605 HW#10
Markov Chain
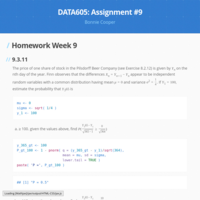
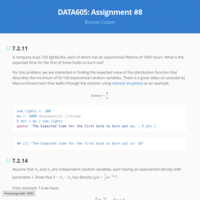
DATA605 HW#9
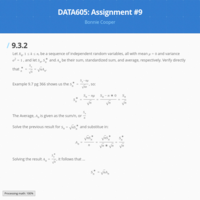
central limit theorem etc.
Discussion Week9
9.3.2
Discussion Week8
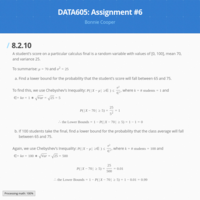
Chebyshev's Inequality 8.2.10
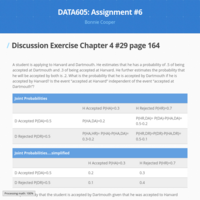
Discussion Week6
conditional and joint probabilities
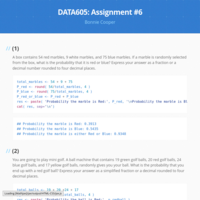
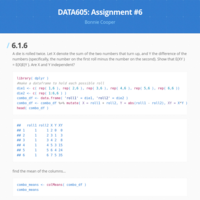
DATA605 HW#6
Combinatronics & Probabilities
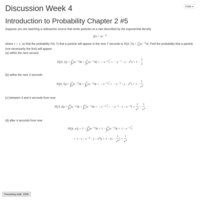
Discussion Week5
Introduction to Probability: Continuous Density Functions exercise
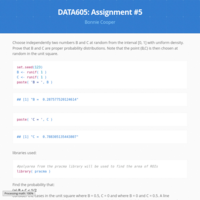
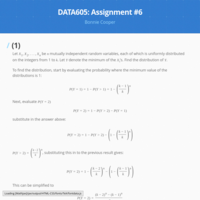
DATA605 HW#5
Uniformly distributed random numbers
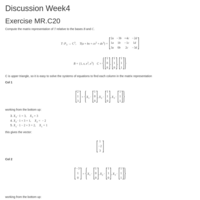
Matrix Representation
Discussion Week4: Compute the matrix representation of T relative to the bases B and C
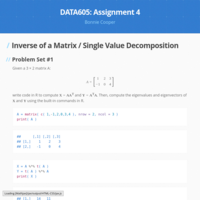
DATA605 HW#4
Inverse of a Matrix & Single Value Decomposition
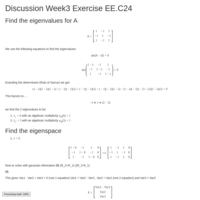
Eigenvalue/vector Example
Discussion Week3 for Eigenvalues & Eigenvetors
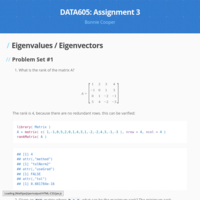
DATA605 HW #3
Eigenvalues & Eigenvectors
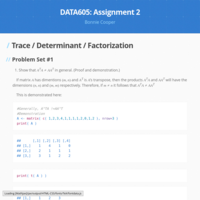
DATA605 HW#2
Trace, Determinant & Factorization
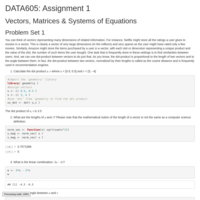
DATA605 HW#1
Vectors, Matrices & Systems of Equations


RPSLS Simulation
A simple python simulation of a game of chance

FEMA Disaster Declarations: visualization & polynomial regression
The FEMA Disaster Declaration Summary dataset holds a record for every declaration of natural emergency since the early 1950. This analysis tours the dataset and models the duration of declaration over the years.

COVID-19 Mortality in US Counties Presentation
Slides for project presentation

COVID-19 Mortality in US Counties
a look at COVID-19 deaths by county and comparison with mortality rates for other leading causes of death in the US
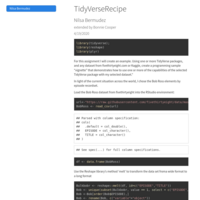
Tidyverse Extend
my extension of Nilsa Bermudez' assignment. Part of a group project to practice version control with group collaboration. Here, I just added some text and a brief chunk of code to use tidyr & dplyr methods
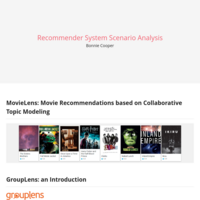
Recommender Systems Summary
A brief overview and UX glance at MovieLens
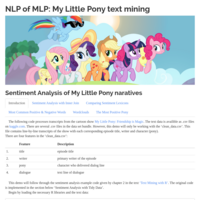
NLP of MLP: My Little Pony text mining
follows chapter2: Sentiment Analysis with Tidy Data in Text Mining with R using the My Little Pony transcript data set from kaggle.com. Here the nlp R libraries tidytext and syuzhet are used to weight positive and negative sentiments with respect to narrative duration and character.
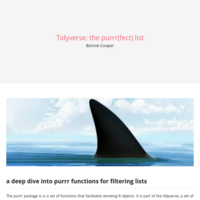
purrr list filtering functions
Tidyverse vignette to demonstrate purrr list filtering function: pluck(), compact(), keep() & more

FEMA Disaster Declarations Project Proposal
Project proposal and preliminary descriptive stats for an analysis of turn-around time duration for different classifications of disasters.

NYTs' Best Selling Manga
R code to directly access information from the New York Times Books API, read in the JSON data to an R DataFrame, 'tidy' the data with tidyverse methods and visualize the results
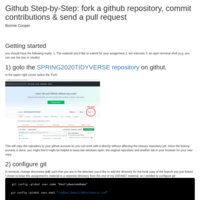
Github Step-by-Step
fork a github repository, commit contributions & send a pull request
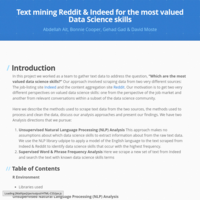
Scraping Reddit Comments
Some vary basic web scraping of reddit comments using the redditExtractoR library and text mining with the 'tm' library to create a wordcloud of most frequent words.
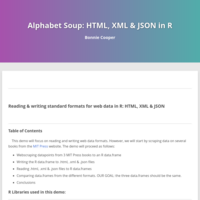
Alphabet Soup: HTML, XML & JSON in R
This demo will focus on reading and writing web data formats (.html, .xml & .json) in R. However, we will start by scraping data on several books from the MIT Press website.
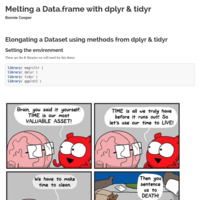
Melting an R data.frame with dplyr & tidyr methods
This demo walks through reading & writing a .csv file before 'tidying' a dataset using methods from dplyr and tidyr libraries.
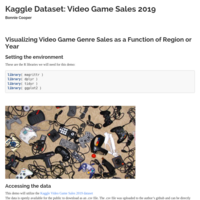
Video Games Sales 2019
Video Game Sales 2019 Dataset from Kaggle is tidied w/ dplyr & tidyr. ggplot is used to visualize the data
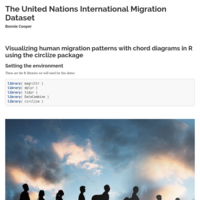
Chord Diagram Visualization of UN Migration Data
The UN International Migration Dataset is tidied w/ dplyr & tidyr. circlize is then used to visualize the data as a chord diagram
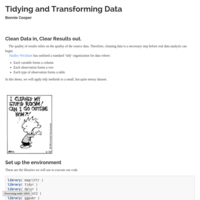
Tidying & Transforming Data
beginning with a small but really quite messy .csv file, use methods from tidyr & dplyr to clean the data and then perform some brief analysis & visualizations
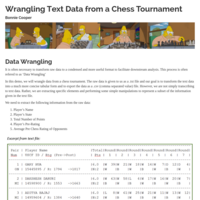
Wrangling Text Data from a Chess Tournament
Given a text file with chess tournament results where the information has some structure, this R Markdown file generates a .CSV file that summarizes information from each player.
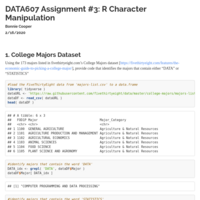
DATA607: R Character Manipulation
working with character strings and dates in R.
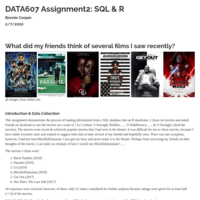
DATA607: SQL & R
loading information from a SQL database into an R dataframe
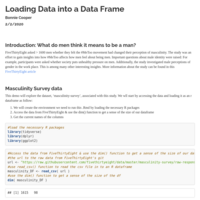
DATA607_Assigment1
Loading Data Into a Dataframe
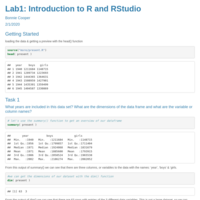
DATA606_Lab1
Introduction to R and RStudio for DATA606 Spring Semester 2020
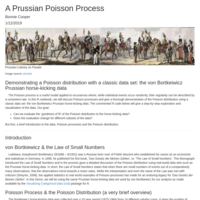
A Prussian Poisson Process
Demonstrating a Poisson distribution with a classic data set: the von Bortkeiwicz Prussian horse-kicking data
Week 2 Homework
This R markdown document completes the homework assignment for week 2 of the R Bridge tutorial for the MSDS2020 Winter Bridge program
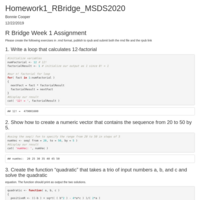
Week1 Homework
This R markdown document completes the homework assignment for week 1 of the R Bridge tutorial for the MSDS2020 Winter Bridge program.