SpiessJ
Johannes Spiess
Recently Published

Capstone Slide Deck
This is the slide deck for the capstone project in the Coursera Data Science specialization. It describes the developed Word Prediction App.


Pitch Presentation Loan Calculator
Presentation for final course project in Coursera's "Developing Data Products"

Pitch Presentation Loan Calculator
Presentation for final course project in Coursera's "Developing Data Products"


Pitch Presentation Loan Calculator
Final Project Coursera "Developing Data Products"


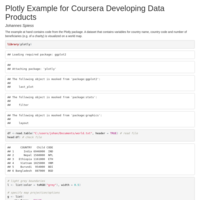
Plotly Example for Coursera Developing Data Products
This is my submission for the Coursera course Developing Data Products.

Plotly Example for Coursera Developing Data Products
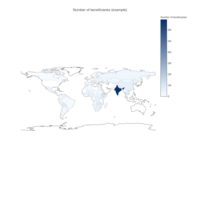
The example at hand contains code from the Plotly package. A dataset that contains variables for country name, country code and number of beneficiaries (e.g. of a charity) is visualized on a world map.
Plotly Example
A Plotly example - number of beneficiaries per country
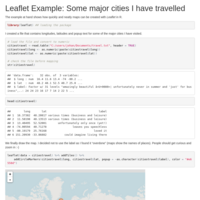
Mapping example with the package Leaflet
The example at hand shows how quickly and neatly maps can be created with Leaflet in R.
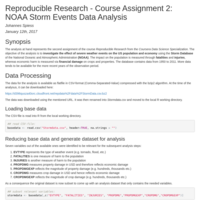
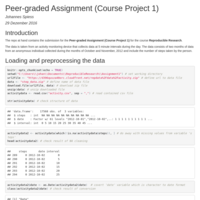
Reproducible Research - Course Assignment 2: NOAA Storm Events Data Analysis
The analysis at hand represents the second assignment of the course Reproducible Research from the Coursera Data Science Specialization. The objective of the analysis is to investigate the effect of severe weather events on the US population and economy using the Storm Database of the National Oceanic and Atmospheric Administration (NOAA).