
Tesfahun_Boshe
TESFAHUN TEGENE BOSHE
Recently Published
Omnichannel
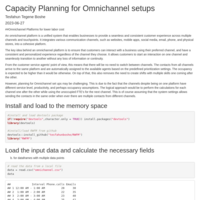
Capacity Planning for Omnichannel setups

Introduction to RWFM
Introduction to RWFM
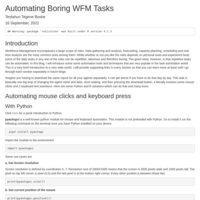
Automating boring WFM tasks
Workforce Management encompasses a large scope of roles. Data gathering and analysis, forecasting, capacity planning, scheduling and real-time analysis are the most common ones among them. While whether or not you like the roles depends on personal taste and experience level, some of the daily tasks in any one of the roles can be repetitive, laborious and therefore boring. The good news, however, is that repetitive tasks can be automated

Erlang calculators with Python
In this article, I share my experience with Python version of Erlang calculators from CCMath.
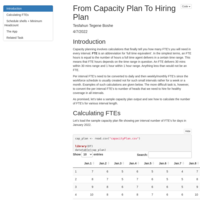
WFM capacity planning, hiring plan and generating schedule shells
In WFM Planning, capacity planning does not end at finding per interval FTE requirement. The next and harder task is to figure out the optimum number of heads and the optimum schedule shells. Please check out my latest Shiny App that can generate both the minimum number of agents and the associated schedule per agent for your desired combinations of FTE's per interval, shift length, number of weekly working days per agent as well as the minimum staffing efficiency.
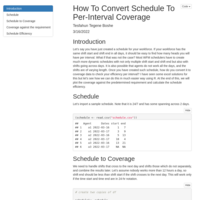
Schedule to Coverage
Let’s say you have just created a schedule for your workforce. If your workforce has the same shift start and shift end in all days, it should be easy to find how many heads you will have per interval. What if that was not the case? Most WFM schedulers have to create much more dynamic schedules with not only multiple shift start and shift end but also with shifts going across days. It is also possible that agents do not work all the days, and the shifts are of varying length. Once you have created such schedule, how do you convert it to coverage data to check your efficiency per interval? I have seen some excel solutions for this but let’s see how we can do this in much easier way using R. At the end of this, we will plot the coverage against the predetermined requirement and calculate the schedule efficiency.

ARIMA FOR DEMAND FORECASTING
In my last blog at https://rpubs.com/Tesfahun_Boshe/wfmforecasting, I have discussed various forecasting methods and accuracy metrics. This blog is aimed at looking at ARIMA models in-depth. We will start with defining essential terms in time series analysis.
WFM forecasting with R
While there is not a single best method for forecasting, there are widely used methods and best practices. This document discusses some of the most commonly used time series models and hybrid approaches. We will also cover the metrics which can indicate the accuracy of the forecast.
Workforce Management Planning with R
This project aims at creating a working workforce management plan for a chosen customer care unit. Visualization is an important part of workforce management, therefore, we would like to apply visualization techniques covered in the lecture to infer knowledge from the dataset.
A workforce manager is responsible for forecasting the contact volume and staffing appropriate number of heads for the call center. It Is therefore important to forecast the business volume, the inquiry rate, the number of contacts per channel and later the number of heads per interval for healthy customer experience.
The aim is to plan January of the year 2022. Special attention is given to making informative visualization of the data across the calculation steps. Because the insights from the visualization will be necessary for the decisions the workforce manager makes.
This document should inspire the WF managers of all levels to use R and R’s packages for their daily tasks in this industry which is heavily Excel dependent.
Classification of Census Income Part2
This is the second part to classification Classification of Census Income. This time another set of methods have been applied, achieving different results.

Classification of Census Income
Classification is a supervised machine learning algorithm of assigning a class label based on known examples. There are many different types of classification tasks requiring machine learning approaches such as those to be discussed below. In this document, we will try to predict a person's income based on census data.
The predictions will be either above 50K or below 50K. Since the dependent variable is of a categorical type, we have a classification problem at hand.
While there are numerous techniques of classification, we will apply the following three and compare the results:
Impact of development indicators on the growth rate
This document provides a panel data model for countries’ development indicators. The purpose of this research was to figure out the most deterministic factors for GDP growth. First, the dataset was analysed briefly. Then after, the best fitting model was picked by following standard test results. The chosen model was finally be evaluated numerically and empirically. The resulting model shows that GDP growth rate highly depeneds on the country’s oppenness to the world and on the presence or absence of active armed conflict. Some variables like corrupton index were surprisingly were deemed insignificant, however, we understand that this could be an indication of a poor model.

Predicting the net hourly electrical energy output of a combined cycle power plant
In this article discusses prediction of net hourly electrical energy output of a combined cycle power plant using four different regression models. The dataset contains 36733 instances of 11 sensor measures aggregated over one hour (by means of average or sum) from a gas turbine located in Turkey's north western region for the purpose of studying flue gas emissions, namely CO and NOx (NO + NO2). We believe the dataset can be well used for predicting turbine energy yield (TEY) using ambient variables as features.We will discuss the data preparation, variable selection, modeling and testing the models in that order. The models will later be compared using well known metrics.

Associations rule mining
In this project I analyze the association between different items in grocery at found at this link: (https://www.kaggle.com/roshansharma/market-basket-optimization)

Eigen faces of my 3 dogs
This paper is about replication of the usual eigenfaces approach on images of my three dogs: ‘KC’, ‘Soyka’ and ‘Astra’. For simplicity, I took 10 images of each dog for the training set, and few other images for testing.
Clustering Countries Using Descriptive Variables
In this project I used countries data from https://www.kaggle.com/fernandol/countries-of-the-world. After checking the clusteribility of the data, the best clustering method is to be chosen together with the optimum number of clusters. I will also discuss the efficiency of the method applied comparing it to the true classification of world countries, based on another data.