
Thruinin
Tomás A. Maccor
Recently Published

Patient Demographics Dashboard
Dashboard that enables to review & analyze the demographics of the clinical trial participants at a big clinical research institution.

Australia bushfires: statistical analysis and exploratory forecasting
This paper will aim at answering the question:
Is there a statistically significant increase in the incidence (Nr. fires/year) and size of fires, in New South Wales (Australia), since bushfire data started being recorded?

Time Series data analysis and forecasting
Applying ARIMA & ETS models to time series data, choosing the best model and forecasting 5 years ahead on USA GDP data.
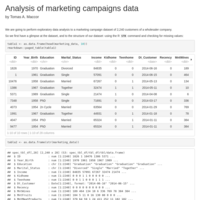
Marketing Campaign - A data analysis
Data analysis of 2240 customers from a company that has launched several marketing campaigns for its products.
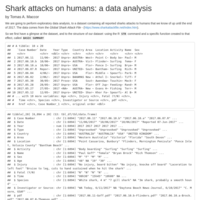
Shark Attacks: a data analysis
An exploratory data analysis of all recorded shark attacks from 1800 to 2017
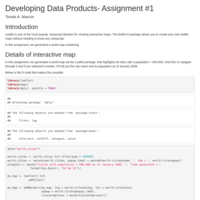
A text prediction ShinyApp - Capstone Project - JHopkins DS Specialization
Presentation/sales pitch of "The Typing Caddie" - A text prediction ShinyApp.
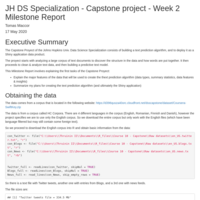
Final assigment of the Capstone Project in the Johns Hopkins Data Science Specialization.
Document
"Typing caddie" -- a predictive text application.
Milestone Report for the Capstone Proyect of the J. Hopkins Data Science Specialization.

Shiny Application - Visualising the RMS Titanic Data
A basic Shiny App that enables user to explore the survival data of RMS Titanice by passenger Category & Sex.
Exploring densely populated cities of the world
This is an interactive map created with R Leaflet package.
It allows the use to navigate the world map and locate all cities in the world with a population > 500,000.
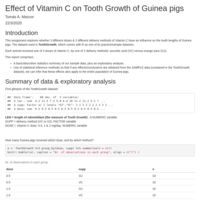
Use of Statistical Inference to determine the effect of Vitamin C on Tooth Growth in Guinea pigs
Use of Statistical Inference to determine if Vitamin C has an effect on the tooth growth of Guinea pigs.
Reproducible Research & Exploratory Analysis of personal workout monitoring data
Analysis of data from a fitness band over 2 months for a subject.
Coursera Duke R - Probability and Data - Sample exploratory analysis
Sample from Week 4
Coursera Data Science Specialization - Reproducible Research - Assign #2
Analysis of the NOOA STORM database.