
abhijitjantre
Abhijit Jantre
Recently Published
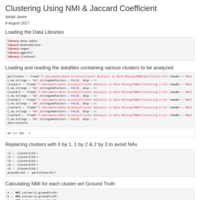
Calculating & Comparing NMI & Jaccard Coefficient scores
Calculating & Comparing NMI & Jaccard Coefficient scores for the given clusters
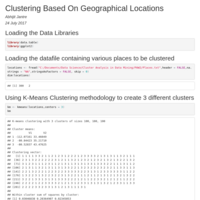
Clustering Based On Geographical Locations
Using R programming & K Means algorithm of clustering, given location data points are assigned to 3 clusters.
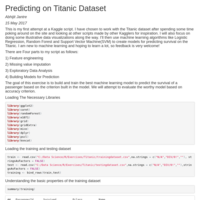
Predicting On The Titanic Survival
The project covers predicting survivals on Titanic ship based on various machine learning algorithms. I predicted the survival after conducting following steps
1) Feature engineering
2) Missing value imputation
3) Exploratory Data Analysis
4) Statistical Inference
5) Building Models for Prediction
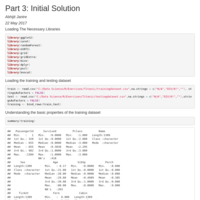
Initial Solution for Titanic: Machine Learning from Disaster
1) Feature engineering
2) Missing value imputation
3) Exploratory Data Analysis
4) Building Models for Prediction
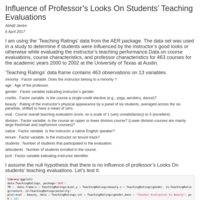
Influence of Professor's Looks On Students' Teaching Evaluations
This project statistically tests whether the gender bias and looks of the professor affect the professor’s teaching evaluation done by the students.

Investment Portfolio Analysis And Allocation To Get Optimum Profit Using Sharpe Ratio
In this project, historical stocks/bonds/commodities prices of any listed company/bod/commodity in the world are fetched and compared automatically.
Going further, you can choose the stocks/bonds/commodities for the portfolio and using this project, you can allocate your funds by merely updating the 'stocks' vector and the project suggest the best allocation of funds for your stocks to get the maximum returns on your portfolio at any time.
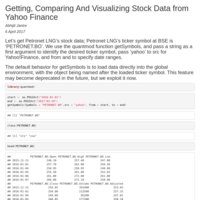
Getting, Comparing And Visualizing Stock Data from Yahoo Finance
This project extracts the stock data from Yahoo Finance. Different Stocks's data are compared. Comparative charts are plotted for Annualized Returns.

Presentation on Application of NLP For Predicting The Next Word
This is a presentation for predicting the next word based on last 1,2 or 3 words using Natural Language Processing (NLP). This presentation contains link for codes on Git-Hub and Shiny Server.
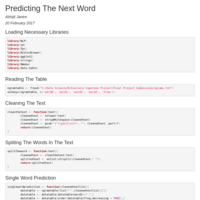
Predicting The Next Word Using Natural Language Programming
I created a robust program using n-grams table to clean the given text/word/phrase and then split the text. The program computes the next word based on the last one or two or three or more than 3 words in a given text.
The application is also posted on Shiny Server.
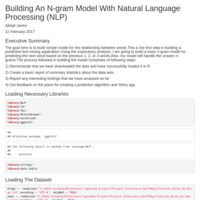
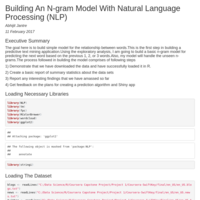
Building An N-gram Model With Natural Language Processing (NLP)
The goal here is to build simple model for the relationship between words.This is the first step in building a predictive text mining application.Using the exploratory analysis, I am going to build a basic n-gram model for predicting the next word based on the previous 1, 2, or 3 words.Also, my model will handle the unseen n-grams.
NLP
The goal here is to build simple model for the relationship between words.This is the first step in building a predictive text mining application.Using the exploratory analysis, I am going to build a basic n-gram model for predicting the next word based on the previous 1, 2, or 3 words.Also, my model will handle the unseen n-grams.
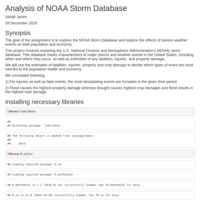
Analysis of NOAA Storm in USA
In one of the other data analytics project named ‘Analysis of NOAA Storm in USA’, my goal of the project was to analyze the storms in USA and track the characteristics of major storms & weather events in USA. Using exploratory data analysis, I analyzed over 9 lac observations and concluded that tornados are the most devastating events in USA while flood causes the highest socioeconomic damage in USA.
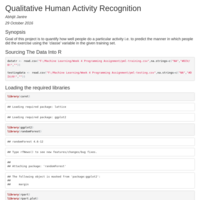
Qualitative Human Activity Recognition
In one of the predictive data analytics machine learning project named ‘Qualitative Human Activity Recognition’, my goal was to predict using data from accelerometers on the belt, forearm, arm and dumbbell of 6 participants. They were asked to perform barbell lifts correctly and incorrectly in 5 different ways. After cleaning the dataset, I created training & test datasets. I then computed area under ROC curve for training set to check goodness of fit. I employed predictions models like Decision Tree Model (DTM), Linear Discriminant Analysis (LDA) Method, Random Forest (RF) Method. I tested accuracy of each of these prediction algorithms. I predicted using RF Method with 99.41 % accuracy and 0.59% out of sample error rate.
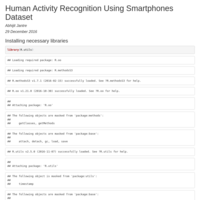
Human Activity Recognition using Smartphones
One of the most exciting areas in all of data science right now is wearable computing. Companies like Fitbit, Nike, and Jawbone Up are racing to develop the most advanced algorithms to attract new users. The experiments have been carried out with a group of 30 volunteers within an age bracket of 19-48 years for this project named ‘Human Activity Recognition using Smartphones Dataset’. Each person performed six activities (WALKING, WALKING UPSTAIRS, WALKING DOWNSTAIRS, SITTING, STANDING, LAYING) wearing a smartphone (Samsung Galaxy S II) on the waist. The raw dataset hence created was processed to produce an independent tidy dataset of mean and standard deviations of each of the 30 participants for each of the above-mentioned activities.
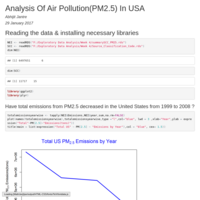
Analysis Of Air Pollution(PM2.5) In USA
In the project titled as ‘Analysis Of Air Pollution(PM2.5) In USA’, I performed exploratory data analysis to determine change in PM2.5 emissions across USA and in cities like Baltimore and Los Angles. I also investigated the sources of PM2.5 emissions and analyzed the trend of emissions. It was concluded that although the PM2.5 emissions across USA have declined but some states have witnessed zigzag trends. Different trends were also noticed for different sources of pollutions in some of the states.
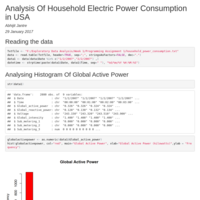
Analysis Of Household Electric Power Consumption in USA
While analyzing household electric power consumption on typical days, I studied global active power, voltage, global reactive power and meter-wise energy consumption together and separately. Sub-meters 1,2&3 were installed at kitchen, laundry room and air conditioner plus water heater respectively. It was found that kitchen consumes most power in comparison when all meters are in use.

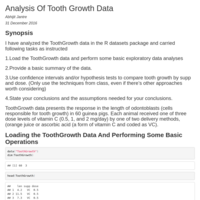
Statistical Analysis Of Tooth Growth for 60 Guinea Pigs
As a statistical analysis project, I analyzed the tooth growth data for 60 guinea pigs. Each animal received one of three dose levels of vitamin C (0.5, 1, and 2 mg/day) by one of two delivery methods, (orange juice or ascorbic acid (a form of vitamin C and coded as VC). Based on p value which was larger than 0.05, I arrived at the conclusion that the observed difference of tooth length means across supplement types was statistically not different from 0.However, I also found that tooth length indeed varies across groups of dose levels and all the variations are statistically significant.


Use of Interactive Graphic Packages Like Shiny
Utilizing interactive graphic packages like shiny, I created summary, structure, data and plots pertaining to a dataset in the output panel using reactive function. In this project, I used various widgets like Radio buttons, Slider and Checkboxes.
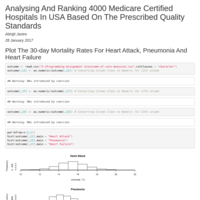
Analysing And Ranking 4000 Medicare Certified Hospitals In USA Based On The Prescribed Quality Standards
The project named ‘Analyzing And Ranking 4000 Medicare Certified Hospitals In USA Based On The Prescribed Quality Standards’ was aimed at assessing and ranking quality standards across certified hospitals. With the help of R-Programming, I plotted 30-day mortality rates for Heart Attack, Pneumonia And Heart Failure and subsequently determined the best hospital in a state. I also ranked all the hospitals in a state and across all the states for the given outcome of medical disease by using R-Programming.
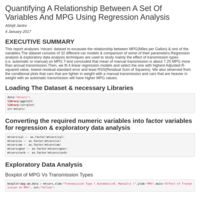
Quantifying A Relationship Between A Set Of Variables And MPG Using Regression Analysis
While working on the project named ‘Quantifying A Relationship Between A Set Of Variables And MPG (Miles Per Gallon) Using Regression Analysis’, I used Regression Analysis & Exploratory Data Analysis techniques to study mainly the effect of transmission types (i.e. automatic or manual) on MPG.T-test concluded that mean of manual transmission is about 7.25 MPG more than annual transmission. Then, I developed 4 linear regression models and selected the one with highest Adjusted R-squared value, lowest residual standard error and least RSS (Residual Sum of Squares). I also observed from the conditional plots that cars that are lighter in weight with a manual transmission and cars that are heavier in weight with an automatic transmission have higher MPG values.
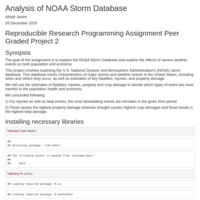
Reproducible Research Programming Assignment Peer Graded Project 2
Analysis of NOAA Storm Database

Data Products Week 4 Programming Assignment
Creating Summary, Structure, Data & Plot Tabs In The Output Panel Using Reactive Function

Data Products Week 3 Programming Assignment (Plotly)
Data Products Week 3 Programming Assignment (Plotly)

Data Products Week 2 Programming Assignment
My Houses presentation using R Markdown & Leaflet
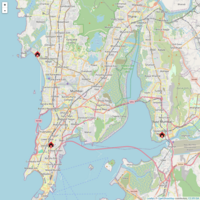
Coursera Data Products Week 2 Assignment
My Houses presentation using R Markdown & Leaflet

My First R Presentation
My First R Presentation