
adhokshaja
Pradeep Adhokshaja
Recently Published
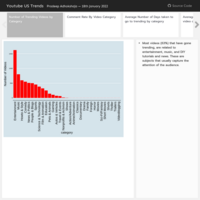
Youtube US Trends
Flexdashboard using Youtube Statistics data from Kaggle
https://www.kaggle.com/datasnaek/youtube-new
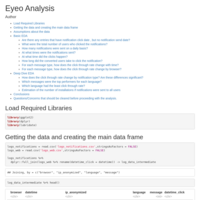
Eyeo Data Science Test
Recruitment Test for Eyeo. Please do let me know how I can improve this.
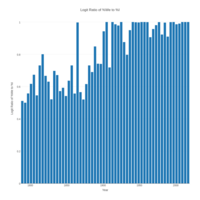
plotly visualization
Logit ratio of %We to %I
networkD3 visualization of most correlated terms in presidential inaugural addresses
networkD3 visualization of most correlated terms in presidential inaugural addresses
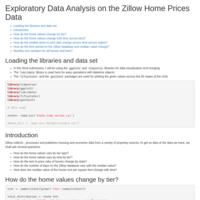
Visualizing Energy Production in Costa Rica
Presentation analysing energy data for the period of Oct 2016. The dataset can be found on Kaggle.
Analysing Christmas Tweets
This is a script in R. to analyse tweets related to Christmas . The R Markdown format is used here for output
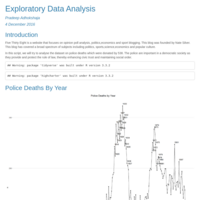
Preliminary Data Analysis of Police Death Data
My Kaggle Script on police death data