
airsafe
Todd Curtis
Recently Published

Observed racial disparities in the Boston Police Department FIO program
A review Boston Police Department (BPD) Field Interrogation and Observation (FIO) data from the period 2011-April 2015 revealed that among the BPD officers who submitted FIO reports in that period, the 20% of the officers who submitted the most FIO reports were significantly more likely to have encounters with black suspects, and the remaining group of officers were more likely to have encounters with suspects of other racial groups.
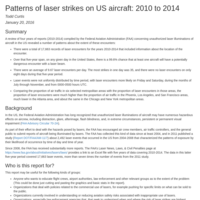
Patterns of laser strikes on US aircraft: 2010 to 2014
A review of four years of reports (2010-2014) compiled by the Federal Aviation Administration (FAA) concerning unauthorized laser illuminations of aircraft in the US revealed a number of patterns about the extent of these encounters:
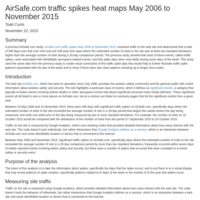
AirSafe.com traffic spikes heat maps May 2006 to November 2015
A previous AirSafe.com study, (http://rpubs.com/airsafe/spikes), reviewed traffic to the web site and determined that a total of 266 days over that over nine and one half year time span where the estimated number of visits to the site was at least two standard deviations higher than the average number of visits during a 28-day comparison period. The previous study showed that most of these events, called traffic spikes, were associated with identifiable aerospace-related events, and that spike days were more likely during some days of the week. This study used the same data from the previous study to create visual summaries of the traffic spike data that would help to further illustrate traffic spike patterns associated with the day of the week and to show if there were also clear patterns showing up in longer time scales.
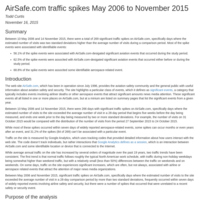
AirSafe.com traffic spikes April 2006 to October 2015
Between April 2006 and October 2015, there were a total of 170 days with significant traffic spikes on AirSafe.com, specifically days where the estimated number of visits to the site exceeded the average number of visit in the 21 preceding days by more than two standard deviations, frequently occurred within 72 hours of widely reported events involving airline safety and security, but there were a significant fraction of spikes that occurred that were unrelated to a significant event.
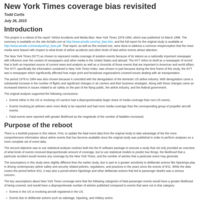
New York Times coverage bias revisited
This project is a reboot of the report “Airline Accidents and Media Bias: New York Times 1978-1994, which was published 14 March 1996. The summary is available on the site AirSafe.com at http://www.airsafe.com/nyt_bias.htm, along with links to the original study, and to the data used in the original and updated studies.
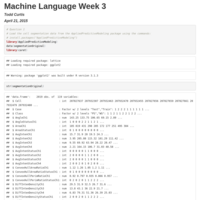

Practical Machine Learning Project - April 2015
Devices that measure detailed, quantified, information about personal activity allow the measurement of both the quantity and quality of that activity performed by the four study subjects. The data in this project comes from accelerometers placed on the belt, forearm, arm, and dumbell of six participants. They were asked to perform one set of 10 repeitions of barbell lifts correctly, and also incorrectly in four different ways.
These five different kinds of outcomes were associated with five distinct output classifications, and were coded as the dependent variable in the training data set.


Developing Data Projects
Shiny app plus Slidify presentation
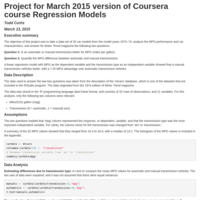
Project for March 2015 version of Coursera course Regression Models
The objective of this project was to take a data set of 32 car models from the model years 1973–74, analyze the MPG performance and car characteristics, and answer for Motor Trend magazine the following two questions:
Question 1: Is an automatic or manual transmission better for MPG (miles per gallon)
Question 2: Quantify the MPG difference between automatic and manual transmissions
A linear regression model with MPG as the dependent variable and the transmission type as an independent variable showed that a manual transmission vehicles better, with a 7.25 MPG advantage over automatic transmission vehicles.

HarvardX: PH525.2x Matrix Algebra and Linear Models
Questions and answers from the course
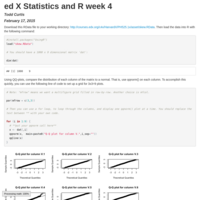
HarvardX: PH525.1x Statistics and R for the Life Sciences - Week 4 notes
Week 4 notes with partial solutions. Note: had to put '#' comments in front of any 'install.xxx' command for knit to work.

Reproducible Research: Peer Assessment 2
The primary of this report is to explore and process the NOAA Storm Database in order to answer the following questions:
Across the United States, which types of events (as indicated in the EVTYPE variable) are most harmful with respect to population health?
Across the United States, which types of events have the greatest economic consequences?
In addition, following report contains a Results section and several plots to illustrate the analysis and the answers to the basic questions. All computer code used in the analysis, as well as links to the original data, is included.

Statisical Inference Course Project - ToothGrowth
This report analyzed data on tooth growth in guinea pig subjects that was contained in the ToothGrowth data set from R. The report will describe the results of some basic exploratory analyses of the subject data, and will include a summary of the data well as a summary of insights into the data that were gained by interpreting the results of data analysis using inferential statistics such as hypothesis tests.
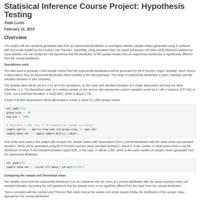
Statisical Inference Course Project
This project will use randomly generated data from an exponential distribution to investigate whether sample means generated using R conforms with the results implied by the Central Limit Theorem. Specifially, using simulated data, the report will analyze the data using inferential statistics to show whether one can accept the null hypothesis that the distribution of the sample means from an exponential distribution is significantly different from the normal distribution.
First test publication
Test publication after signup, no new content