
alecri
Alessio Crippa
Recently Published


A brief overview of The statistical engine behind ProBio
Set of slides presented at the ProBio International Investigator’s Meeting in 2022 and at a meb biostat seminar

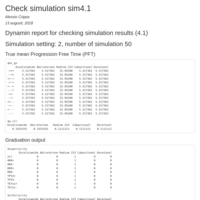
Orsini N. Weighted mixed-effects dose–response models for tables of correlated contrasts
R code to reproduce the results of Orsini et a, (2021), Weighted mixed-effects dose-response models for tables of correlated contrasts. Stata Journal.
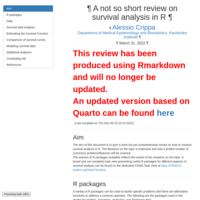
A not so short review on survival analysis in R
Updated version of https://rpubs.com/alecri/survR

A review of Longitudinal Data Analysis in R
Based on "Regression models for dependent data" by Nicola Orsini

A modern demonstration of R for epidemiologists
R Workshop for students in the DIS - Study abroad in Scandinavia program
Lecture notes Biostatistics I: Confounding and Interaction
Based on Nicola's material.

Supplementary R code for Statistical Methods for Meta-Analysis
This page is a supplementary material for the lecture Statistical Methods for Meta-Analysis, in the course Systematic Review and Meta-Analysis.
Logistic regression in R
Supplementary R code for Categorical Data Analysis - Part I in the course Biostatistics II in the master Metodologia Epidemilogica e Bostatistica per la Ricerca Clinica

Implementation and analysis design of an adaptive-outcome trial in R
Slides for useR! 2019, Toulouse - France:
Implementation and analysis design of an adaptive-outcome trial in R

ProBio platform study
Slides for the biostat meeting, 190516


Get started with R (Uppsala), part 2
Slides for the workshop Get started with R, held at Uppsala University Hospital
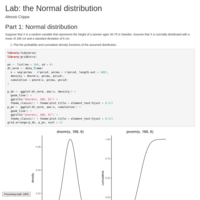
Lab: the Normal distribution
Exercises and solutions for the lab on the normal distribution in the course Basics Statistics (Karolinska Institutet)
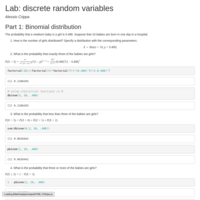
Lab: discrete random variables
Exercises and solutions for the lab on discrete random variables in the course Basics Statistics (Karolinska Institutet)

Ted talks analyses
Rmarkdown to reproduce the notebook used during R Hackathon 2017 (Stockholm) organized by the SRUG meetup.

Get started with R (Uppsala)
Slides for the workshop Get started with R, held at Uppsala University Hospital
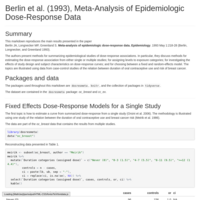
Meta-analysis of epidemiologic dose-response data
R code to reproduce the results of Berlin JA, Longnecker MP, Greenland S. Meta-analysis of epidemiologic dose-response data. Epidemiology. 1993 May 1:218-28.

Visualizing multivariate logistic regression
An rmarkdown to graphically present results from multivariate logistic regression, with examples on modelling interaction and non-linear associations.
fluoride
fluoride presentation


Get started with R
Slides for the workshop Get started with R, held at the deparment of Public Health Sciences - Karolinska Institutet.

Shiny: interactive web applications with R
A very short introduction to shiny.

Meta-analysis of epidemiological dose-response data
I will give a general overview of the methodology for meta-analysis of epidemiological dose-response data. After presenting the relevance and background, I will present the main aspect of the methodology. I will also show how to perform similar analyses using an interactive web application.
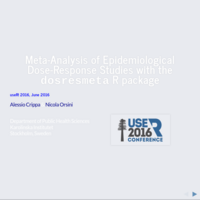
Meta-Analysis of Epidemiological Dose-Response Studies with the dosresmeta R package
Slides for the presentation at the useR! 2016 conference. The aim was to give a short introduction to the methodological framework of dose-response meta-analysis (structure of aggregated data, covariance of correlated outcomes, estimation and pooling of individual curves). I described how to test hypothesis and how to quantify statistical heterogeneity. In addition, tools to flexibly model the quantitative exposure were presented. I illustrated modelling techniques and presentation of (graphical and tabular) results using the dosresmeta R package.

An Introduction to Reproducible Research in R
Reproducible research is a fundamental aspect of research. This presentation is a general introduction on how to conduct reproducible research in R and Rstudio, with a specific focus on literate programming. Practical example analyses were interactively proposed after that.
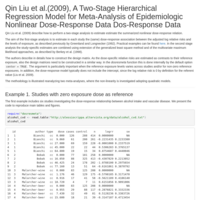
QinLiu
R code to reproduce the results of Qin Liu et a, (2009), A Two-Stage Hierarchical Regression Model for Meta-Analysis of Epidemiologic Nonlinear Dose–Response Data Dose–Response Data.
glst
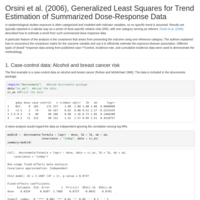
R code to reproduce the results of Orsini et a, (2006), Generalized Least Squares for Trend Estimation of Summarized Dose–Response Data.

Estimating and pooling dose-response curves from published data
It describes the general framework in estimating a pooled dose-response curve from published available data. I will present the results obtained using the “dosresmeta” package of two practical examples: the first one consider a binary outcome, while the latter investigates a continuous one.

Dose-Response Meta-Analysis: an Overview
This is a general overview of the dose-response meta-analysis methodology. After presenting the background, the advantages and the possible limitations of the technique, I will show how to conduct a dose-response meta-analysis based on a real data using the “dosresmeta” R package.