
amekueko
Alexis Mekueko
Recently Published
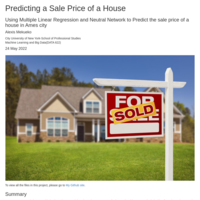
Sale Price of House in Ames city of Iowa
Predicting the price of a house in IOWA using Machine Learning (Neutral Network and Linear Regression)
DecisionTree Vs. Support Vector Machine in R
Looking at the model performance
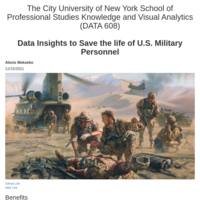
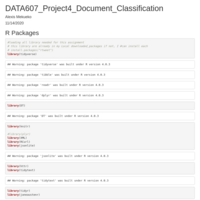
Data608_Final_Project
U.S. Military Casualty 1980-2010
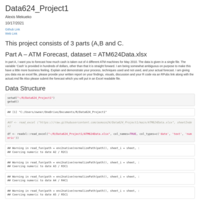
Data624_Project2
Predicting a pH of ABC beverage Company
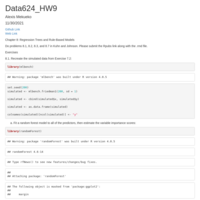
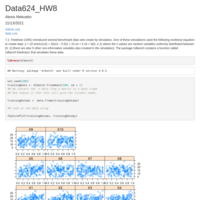

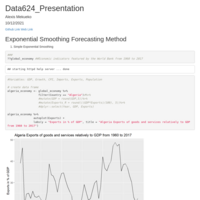
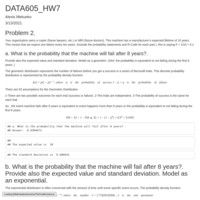
Data624_HW5
Exponential Smoothing
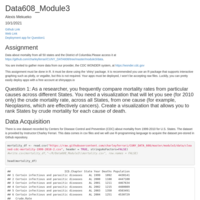
Data608_Module3
Module 3 Interactive Visualizations in R
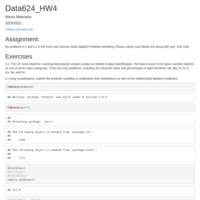
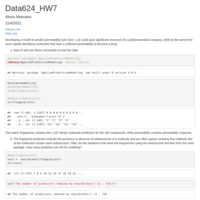
Data624_HW3
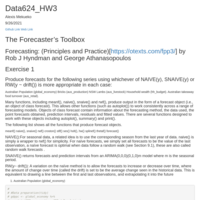
The Forecaster’s Toolbox
Forecasting: (Principles and Practice)[https://otexts.com/fpp3/] by Rob J Hyndman and George Athanasopoulos
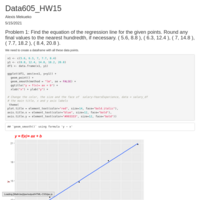
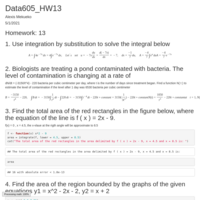
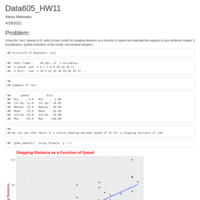
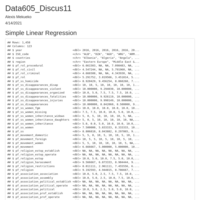
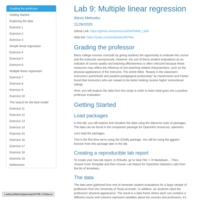
Simple Linear Regression
Intro to Simple linear regression
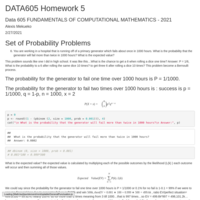
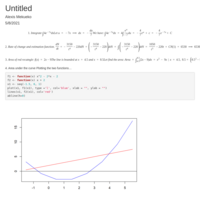
Probability Distribution
Set of Probability problems
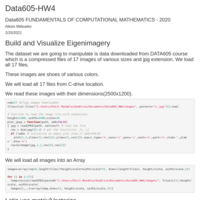
DATA605_HW4
Eigenvalue and images
Linear Algebra: Eigenvalues, Eigenvectors, Eigenspaces in Matrix
Matrix , vectors, and spaces relations
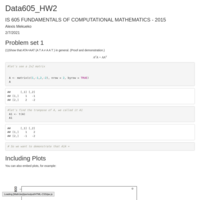
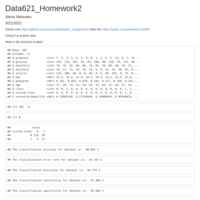
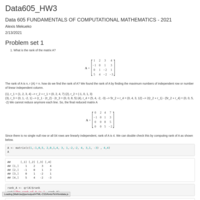
Data605 HW2
Matrix
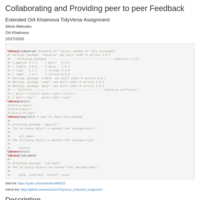
DATA607 Collaborating and Providing peer to peer Feedback
Collaborating and Providing peer to peer Feedback on TidyVerse Assignment
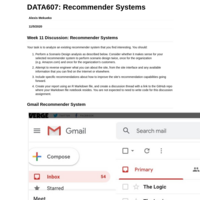
DATA607: Recommender Systems
to analyze an existing recommender system that you find interesting
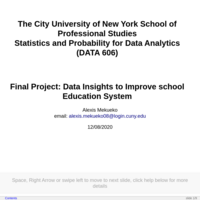
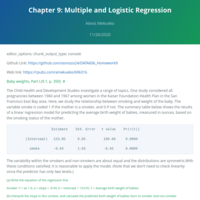
DATA606_Linear_Regression_Presentation
Talking about linear relationships, fitting a line, residuals, and correlation.
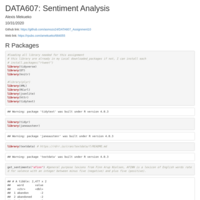
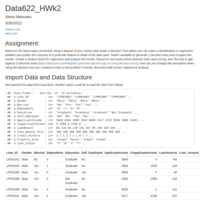
DATA607_Assignment10_Sentiment Analysis
Due Date
Saturday, October 31, 2020 11:59 PM
Points Possible
50
In Text Mining with R, Chapter 2 looks at Sentiment Analysis. In this assignment, you should start by getting the primary example code from chapter 2 working in an R Markdown document. You should provide a citation to this base code. You’re then asked to extend the code in two ways:
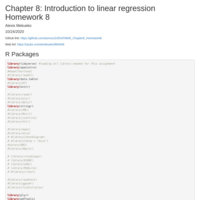
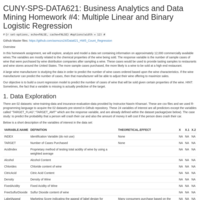
DATA606: Chapter 8: Introduction to linear regression Homework 8
Linear regression
slope, intercept, R-squared, coefficient correlation, overestimate or understimate , independent, dependent
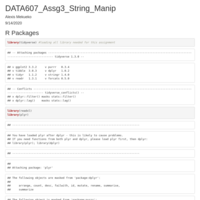
Working with Tidyverse
readr, stringr, dplyr
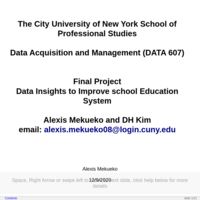
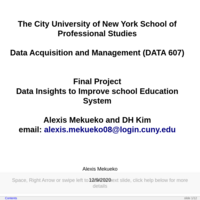
Data Project Proposal
Studying students behaviors...How does study time impact students performance
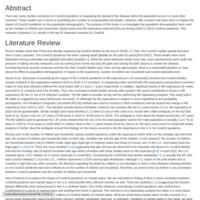
DocumentIntroduction to linear regression
The Human Freedom Index is a report that attempts to summarize the idea of “freedom” through a bunch of different variables for many countries around the globe. It serves as a rough objective measure for the relationships between the different types of freedom - whether it’s political, religious, economical or personal freedom - and other social and economic circumstances. The Human Freedom Index is an annually co-published report by the Cato Institute, the Fraser Institute, and the Liberales Institut at the Friedrich Naumann Foundation for Freedom.
In this lab, you’ll be analyzing data from Human Freedom Index reports from 2008-2016. Your aim will be to summarize a few of the relationships within the data both graphically and numerically in order to find which variables can help tell a story about freedom.

Web APsI in R
This assignment of week 9 is about practicing web API calls. How to get web API in R. Approach: I signed up on New York Time to get an API key. there are various option group in category. I chose the “most”Most Popular" and played around to see what I can get for news. I used GET() for httr request functions on the most shared news within 7days on facebook. glimpse(NyTimes_newsJ) display all the 20 observations of 22 variables. Now I want to print out a link to let’s say a news
DATA606 Chap7 Lab7 Inference for numerical data
Every two years, the Centers for Disease Control and Prevention conduct the Youth Risk Behavior Surveillance System (YRBSS) survey, where it takes data from high schoolers (9th through 12th grade), to analyze health patterns. You will work with a selected group of variables from a random sample of observations during one of the years the YRBSS was conducted.
Working with XML and JSON in R
## Description:
This assginment is about learning how to pull less-structured data from the web. To get started, I will get familiar with R and HTML, XML and JSON formats: For Rmarkdown,, we will create R-srcipt to generate file in HTML, XML and JSON formats. We will use 03 books of a choice and use the R-script to access information about this book and display them. These information include the title, authors, and 2-3 other attributes of three books, at least one having more than one author. This assignment will also give more string manipulation functions and regular expressions.We should have 03 distincts files of the sames books in each of these 03 formats.
DATA606 Chapter 5 Foundations for Inference
p-value, confidence interval, hypothesis test
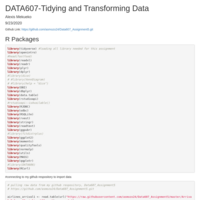
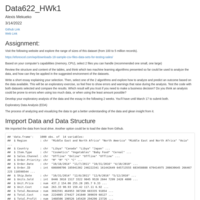
DATA607-Tidying and Transforming Data
The goal of this assignment is to practice in preparing different datasets for downstream analysis work.
DATA_Lab4
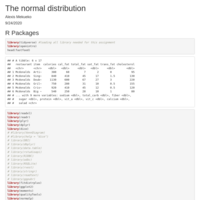
The normal distribution
In this lab, you’ll investigate the probability distribution that is most central to statistics: the normal distribution. If you are confident that your data are nearly normal, that opens the door to many powerful statistical methods. Here we’ll use the graphical tools of R to assess the normality of our data and also learn how to generate random numbers from a normal distribution.
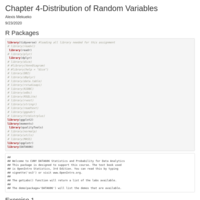
Chapter 4-Distribution of Random Variables
In this chapter, we discuss statistical distributions that frequently arise
in the context of data analysis or statistical inference. We start with
the normal distribution in the
rst section, which is used frequently in
later chapters of this book. The remaining sections will occasionally be
referenced but may be considered optional for the content in this book.
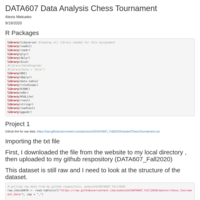
DATA607 Data Analysis Chess Tournament
Data extracting, manipulation, storing, importing , saving
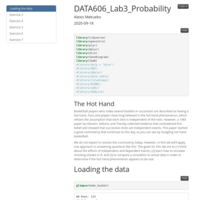
DATA606 Lab3 Probability
Applying probability and computing in basket ball to unveil pattern in basket ball players...Example: The Hot Hand
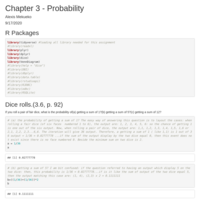
DATA606_Chapter 3 - Probability
Practice probability, sum, disjoint, independent Vs. dependent, sd , mean
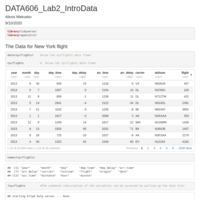
DATA606_Lab2
In this lab we explore flights, specifically a random sample of domestic flights that departed from the three major New York City airports in 2013. We will generate simple graphical and numerical summaries of data on these flights and explore delay times. Since this is a large data set, along the way you’ll also learn the indispensable skills of data processing and subsetting.
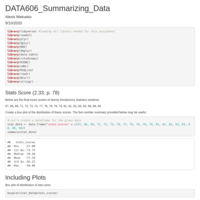
DATA606_Homework2_Chap2
Summarizing data from chapter 2...
DATA_Assg3_College_Major
Always struggle to knit at the end , causing a lot of frustration and creating other bugs
DATA607_Week1 Assignment
Week 1 Assignment...
I had problem publishing this assignment...something with working directory..."Knit error. Object not found" ...So I have to comment out line in order to get it work.
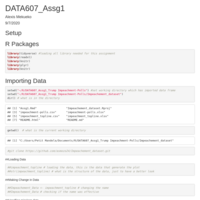
DATA607_Assg1
Week1 assg DATA607