Recently Published
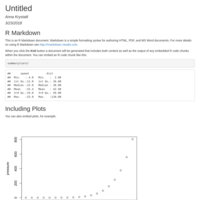
Demo: output
Demo of customising YAML settings
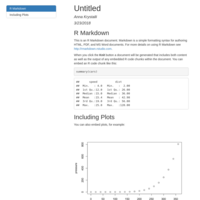
Demo: table of contents
Demo of customising YAML settings
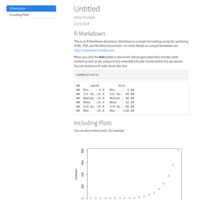
Demo: theme
Demo of customising YAML settings
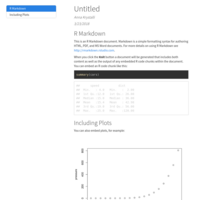
Demo: highlights
Demo of customising YAML settings

ORDA network visualisation
Example visualisation of an association network after modularity analysis. The interactive visualisation uses R package `visNetwork`, a colour palette from package `wesanderson` and includes drop down selection by node or module.
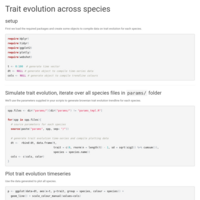
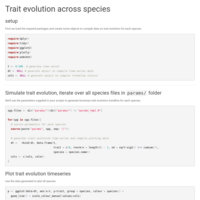
UNAM species trait evolution
Simulations of species traits evolution collected through collaborative github workshop
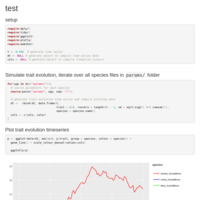
Demo
UNAM rmarkdown workshop demo
#HackTheMarine Talk
Talk given at Hack the City - Marine & Waterways Culture Edition
15 January 2015
Open DEFRA Marine and inland water hack
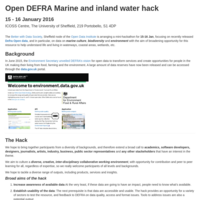
Details of upcoming 'Better with Data' hack
Don't just sit there: interact!
Building interactive data exploratory apps with #shinyapps & @plotlygraphs
Presentation given to Sheffield MolEcol lab meeting, 01/12/2015
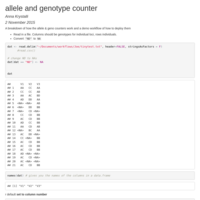
Allele & Geno counter README
README for a snippet of workflow created to count and identify alleles and genotypes across loci
Evolution of Sex Roles in Birds exploratory app demo
Demonstration of shiny (integrating plotly) app to the Sheffield R Users group (17/10/2015)
