
ashishj_sharda
Ashish Sharda
Recently Published


Geom Function -Options
Extra options specified in geom function

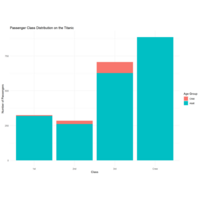
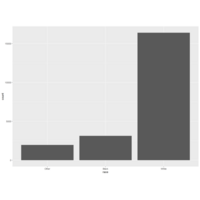
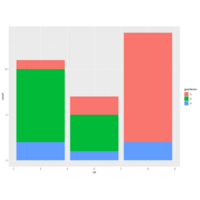
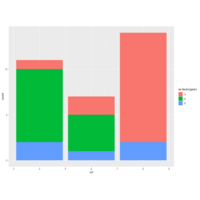
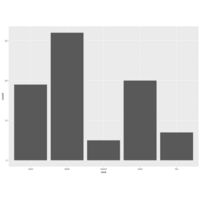
Bar Chart using Titanic Data Set
library(ggplot2)
data("Titanic")
# Convert the 'Titanic' table to a data frame for easier manipulation
titanic_df <- as.data.frame(Titanic)
# Create a bar chart
ggplot(titanic_df, aes(x = Class, y = Freq, fill = Age)) +
geom_bar(stat = "identity") +
labs(
title = "Passenger Class Distribution on the Titanic",
x = "Class",
y = "Number of Passengers",
fill = "Age Group"
) +
theme_minimal()
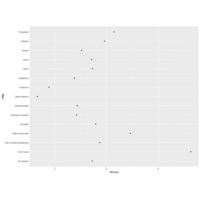
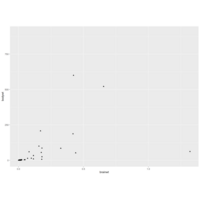
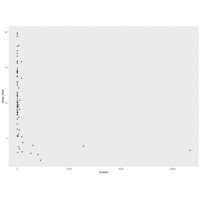
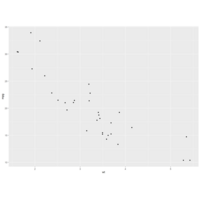
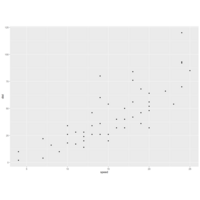
Watching Tv per day
library(forcats)
library(ggplot2)
library(dplyr)
gss_cat
relig <- gss_cat %>%
group_by(relig) %>%
summarize(
age = mean(age, na.rm = TRUE),
tvhours = mean(tvhours, na.rm = TRUE),
n = n()
)
ggplot(relig, aes(tvhours, relig)) + geom_point()
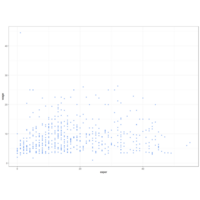
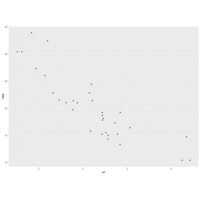
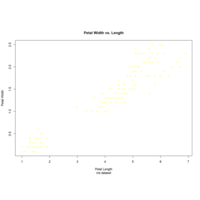
ggplotthememinimal
example using ggplot and theme minimal

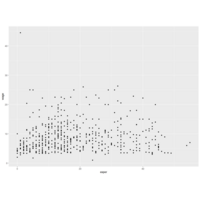
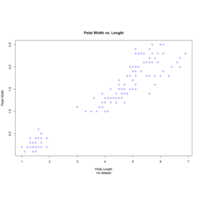
ggplotex21
Example using ggplot
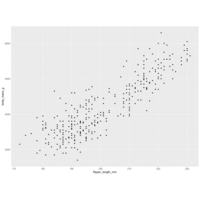
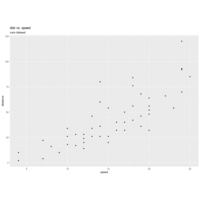
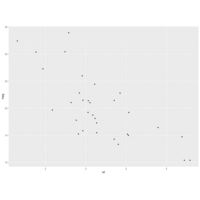
dist vs speed

Cars Data Set
example using cars data set
dplyr
Example using dplyr


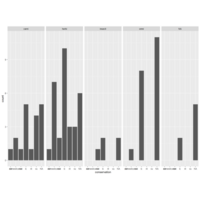
FacetGrid
Example using facet grid

FacetWrapping
ex using facet wrapping

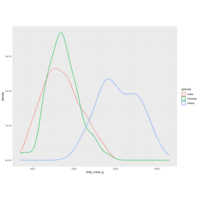
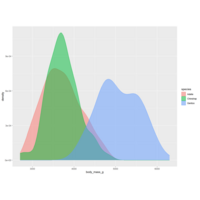
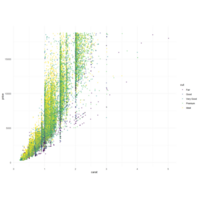
Histogram-MSleep
Example using msleep data set ,use conservation as "fill"
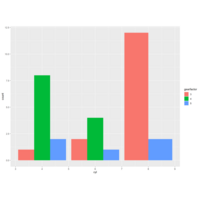
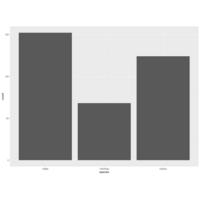
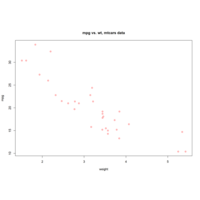
BarPlot
Bar Plot using mtcars data set
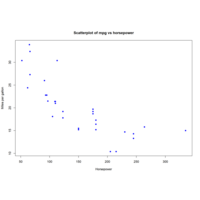
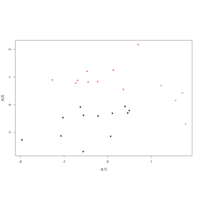
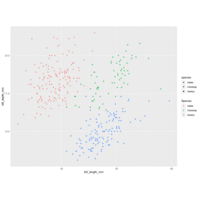
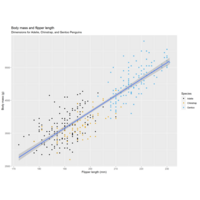
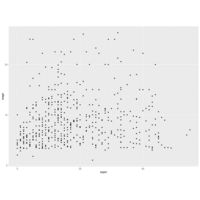
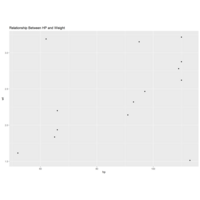
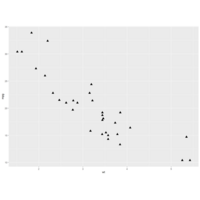
ScatterPlot2
Scatterplot of 2 continuous vars
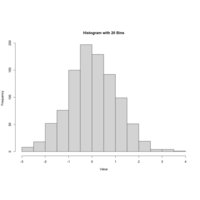
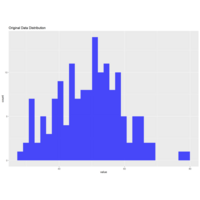
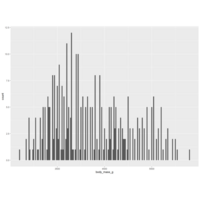
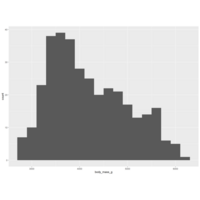
geomhistogram
Geom Histogram Plot


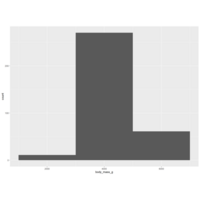
histogram2
set bin width to 1


GGPlot 5
GGPlot 5
Plot-Color Codes
Example using color codes

BasePlotColor
Change color of base plot
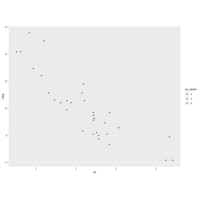
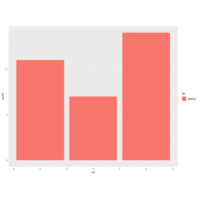
Color
Add color

Axis Labels
Titles and Axis Labels
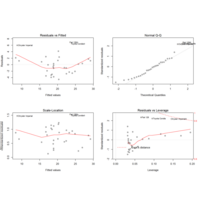
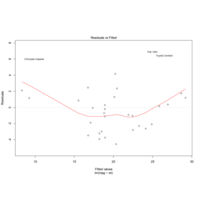
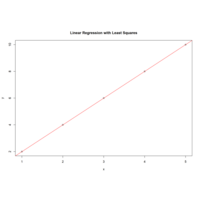
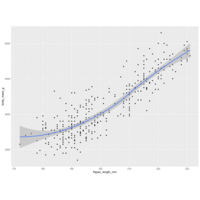
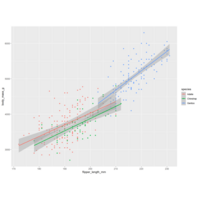
Linear Model -Plot
Example using linear model