
azmanH
Azman Hussin
Recently Published
Visualizing Covid Data For Malaysia - Vaccination and Deaths
Malaysia has made publicly available larger, more detailed, and granular data sets on Covid. This is an initial visual exploration of the deaths data. Many of the visuals we painted from the data raise questions rather than provide answers. In general, the visuals show that the jury is still out there on the effectiveness of Covid vaccinations in preventing Covid deaths.
Malaysian Vaccination Data. Do we have a strategy?
This post shows examples of data visualization of the Covid case and vaccination data including the use of vector maps.
Some of the visuals raise questions on the vaccination strategy adopted by the government. In addition to the slow vaccination rate, we do not see a clear approach in using the vaccination program as part of a larger exit strategy from the current national lockdown.
Visualizing Covid Data With Maps and Network Graphs For Malaysia
Combining Malaysian Covid19 data with maps and network graphs to argue against the national lock-down. There are only 8 out of 90 districts in West (Semenanjung) Malaysia that are problematic. Many districts with low cases are physically far from these "hot" districts.
Visualizing Covid Data With Network Parameters For State of Selangor
This posting has illustrated how to combine Covid case data with a physical geographical network. The various plots exhibited show the difference and added value when the network parameters are incorporated in the analysis.
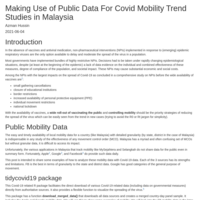
Making Use of Public Data For Covid Mobility Trend Studies in Malaysia
This post is to show how the public mobility data from Apple, Google, and Facebook can help in studying Covid-19 new case trends with mobility for Malaysia.
The Facebook data is more useful because of its granularity, allowing us to analyze at the state and district levels.
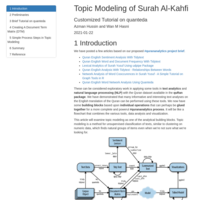
Topic Modeling of Surah Al-Kahfi - A Customized Tutorial on quanteda
This post explored topic modeling for finding clusters of words that characterize a set of documents, which in our case was the 110 verses (ayahs) of Surah Al-Kahfi. We showed how to use the quanteda package through a simple tutorial. We concluded by showing how to create a DTM (DFM) as an input for the **LDA function** from the **topicmodels package**. The tidy() verb let us explore and understand these models using the tidy tools, dplyr and ggplot2.
Numerical and statistical analysis of words from the Quran is a good and "easy" start to #qurananalytics. It is general and robust, requires no or little manual effort, and is “surprisingly” powerful and insightful.
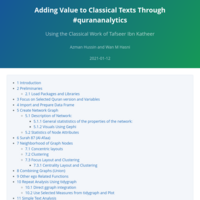
Adding Value to Classical Texts Through #qurananalytics - Using the Classical Work of Tafseer Ibn Katheer
We explore the application of #networkscience tools on the classical works on the interpretation of the Quran to help us visualize the classical method of Interpretation of the Quran with the Quran. It is considered the best method to interpret the verses of the Quran.
This article will focus on providing preliminary findings using network analysis applied to the best of the classical works of Tafseer, Tafseer Ibn Katheer.

Network Analysis of Word Co-occurences in Surah Taa-Haa
As part of our project on #qurananalytics, we cover the characteristics of networks using our example of the word co-occurrence network from Surah Taa-Haa. We show how to use the functions from igraph and tidygraph that measure these characteristics like Degree, Clustering, and Path. It will also serve as a simple tutorial on the characteristics and statistics of networks.
We also showed different ways to use ggraph and its layout formats to visualize the network and its related measures.
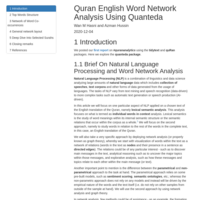
Quran English Word Network Analysis Using Quanteda
We explore the quanteda package for our project on #qurananalytics. We discuss many properties (general and statistical) of the word network that provided lots of insights.
Network Analysis of Word Cooccurrences in Surah Yusuf
This post further explores the word cooccurrence network on our project on #qurananalytics. It will also serve as a simple tutorial on the igraph, tidygraph and ggraph packages.
Quran English Analysis With Tidytext - Relationships Between Words
We continue from our previous report on #qurananalytics using the tidytext and quRan packages. Many interesting text analyses are based on the relationships between words, like examining which words tend to follow others immediately, or that tend to co-occur within the same documents.
In this article, we explore some of the methods tidytext offers for calculating and visualizing relationships between words in the English Quran dataset.
Lexical Analytics of Surah Yusuf Using udpipe Package
We explore the R package udpipe as a tool for our project on #qurananalytics. We use it together with the quRan R package and focus on analyzing a selected Surah, Surah Yusuf.
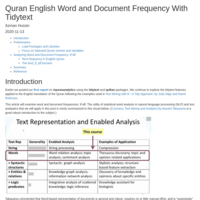
Quran English Word and Document Frequency With Tidytext
We continue to explore the tidytext features applied to the English translation of the Quran. This article will examine word and document frequencies: tf-idf.
Quran English Sentiment Analysis With Tidytext
Preliminary findings using basic text mining analysis on the English Quran data. We replicated some steps in using the quRan and tidytext packages. This article focuses on sentiment analysis.