benwansell
Ben Ansell
Recently Published
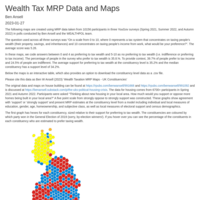
Taxing Wealth MRP
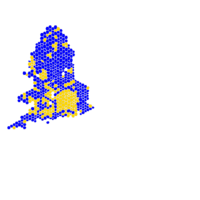
he following maps are created using MRP data taken from 10156 participants in three YouGov surveys (Spring 2021, Summer 2022, and Autumn 2022) in polls conducted by Ben Ansell and the WEALTHPOL team.
The question used across all three surveys was "On a scale from 0 to 10, where 0 represents a tax system that concentrates on taxing people’s wealth (their property, savings, and inheritances) and 10 concentrates on taxing people’s income from work, what would be your preference?". The average score was 5.26.
In these maps, we code answers between 0 and 4 as preferring to tax wealth and 5-10 as no preferring to tax wealth (i.e. indifference or preferring to tax income). The percentage of people in the survey who prefer to tax wealth is 35.8.%. To provide context, 39.7% of people prefer to tax income and 24.5% of people are indifferent. The average support for preferring to tax wealth at the constituency level is 35.2% and the median constituency has a support level of 34.2%.
Below the maps is an interactive table, which also provides an option to download the constituency level data as a .csv file.
Please cite this data as Ben W Ansell (2023) 'Wealth Taxation MRP Maps - UK Constituencies'
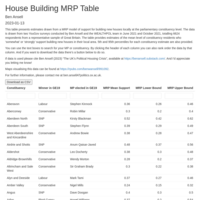
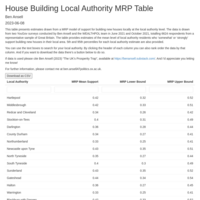
House Building MRP Table
This table presents estimates drawn from a MRP model of support for building new houses locally at the parliamentary constituency level. The data is drawn from two YouGov surveys conducted by Ben Ansell and the WEALTHPOL team in June 2021 and October 2021, totalling 6624 respondents from a representative sample of Great Britain. The table provides estimates of the mean level of constituency residents who ‘somewhat’ or ‘strongly’ support building new houses in their local area. 5th and 95th percentiles for each constituency estimate are also provided.
If data is used please cite Ben Ansell (2023) “The UK’s Political Housing Crisis”, available at https://benansell.substack.com/.
Maps visualising this data can be found at https://rpubs.com/benwansell/991092.
For further information, please contact me at ben.ansellATpolitics.ox.ac.uk.
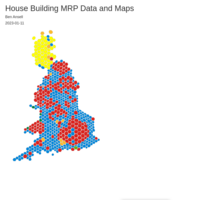
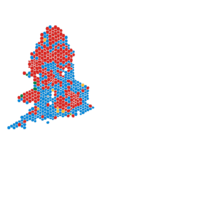
House Building MRP Maps - UK Constituencies - Ben W.Ansell
Maps created using MRP data taken from 6700+ participants in 2021 and 2022 in polls conducted by Ben Ansell. Participants were asked "Thinking about new housing in your local area. How much would you support or oppose more homes being built in your local area?" A five point scale from strongly oppose to strongly support was constructed. These graphs show agreement with 'support' or 'strongly support' and present MRP estimates at the constituency level from a model including individual and local measures of education, gender, age, homeownership, and subjective class, as well as local measures of electoral support and census demographics. Please cite this as Ben W Ansell (2023) 'House Building MRP Maps - UK Constituencies'

COVID School Policy Preferences in the UK
Results from school policy analysis of COVID two wave survey
Coping With Covid - Vaccine Analysis
Preliminary results and analysis from two-wave COVID Survey: Ben Ansell, Martin Bauer, Jane Gingrich, Jack Stilgoe.