
birasafab
Fabrice BIRASA
Recently Published
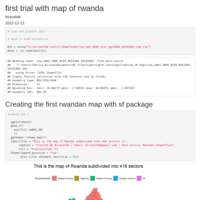
code that generated rwandan map
rwandan map subdivided into 416 sectors.
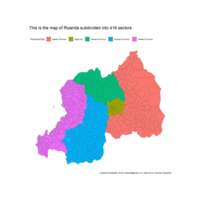
Plot_Rwanda_map
this is the Rwandan map created with sf package in r

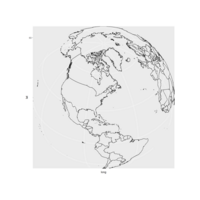
Plot_3d
this is my first attempt to plot a 3D map in R
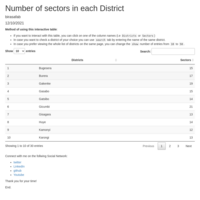
Sectors per each district
Number of sectors per each district
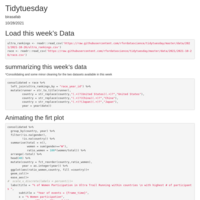
Tidytuesday_Ultra_Trail_Running
the data contained in this document were reposited on tidytuesday Github page by R Learning community
Document
this is just a test for publishing on Rpubs.com
Plot Need to Learn How Coord_quickmaps workk
this was plotted by using the help page from
?coord_quickmap() in r
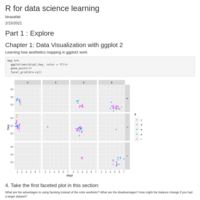
Codes used while learning R for data science
only codes and their outputs as well as some comments for clarification
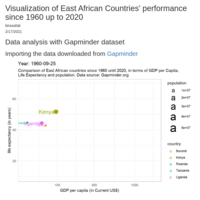
visualization of East African countries data 1960-2020
very beautifull visualization!
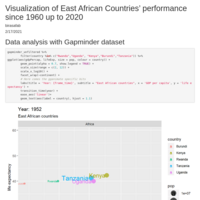
Comparison of East African countries
5 East African countries were compared in terms of their GDP per capita, population, and life expectancy over the period from 1960 to 2020
Draft analysis
my first draft
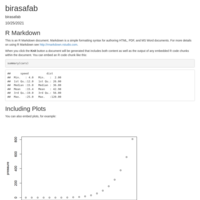
my First Document
This is the project of my learning to use R in my daily data analysis
My Very First Publication
this is the first publication I have put on this site. great achievement. for just posting it here.