
carbonmetrics
Henk Harmsen
Recently Published
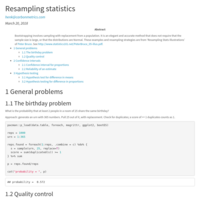
Resampling statistics examples
Bootstrapping is an intuitive and formula-free way of calculating confidence intervals, hypothesis testing and sample sizes without the need for large samples or Normal distributions.
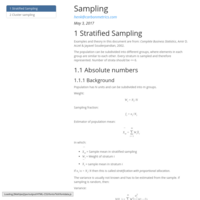
Stratified & Cluster sampling
How stratified sampling and cluster sampling works, with examples.
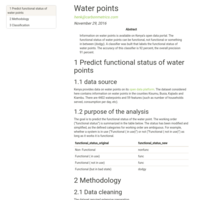
Water point quality in Kenya
Information on water points is available on Kenya's open data portal. The functional status of water points can be functional, not functional or something in between (dodgy). A classifier was built that labels the functional status of water points. The accuracy of this classifier is 92 percent, the overall precision 88 percent.

parcoords test
Test parcoords library with different layouts
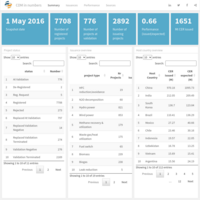
Clean Development Mechanism (CDM) in numbers
Dashboard using data from UNEP/RISOE and IGES.
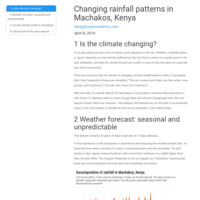
Rainfall patterns in Machakos, Kenya
Time series analysis of rainfall per dekad (10 days) over 30 years. There is some evidence that the rainy season is starting to arrive later than it used to.
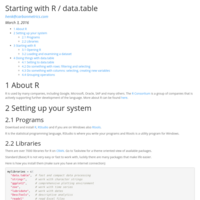
Starting with R / data.table
How to set up R, install packages and work with data.table.

Regression & Diagnostics
Sample data is analyzed with OLS.
Diagnostic plots & remediation of non-conformities with OLS assumptions.
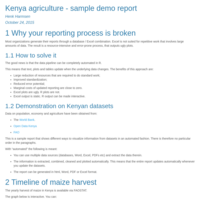
Sample report for Kenya
Combine data from FAO, World Bank and the Government of Kenya to generate an interactive report.
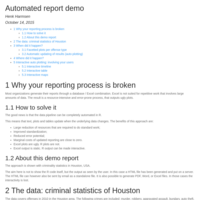
Automated report demo
Reporting in most organizations involves a database/Excel combination. This process is resource-intensive, error-prone and it outputs boring reports. It also degrades trained people to data monkeys. There is good news, however. The entire pipeline, including quality control can be done in R and made interactive. This demo shows how.

Data exploration with R/data.table
Presentation for Upande.com in Nairobi
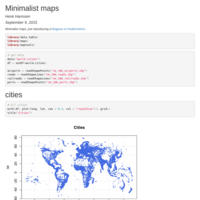
Minimalist maps (reproduce from Freakometics)
Plotting a large series of objects on a world map defines the world map.

data.table presentation for iHub Nairobi
Sets out the basics of data.table.
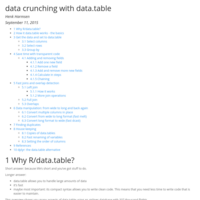
Data crunching with data.table
Overview of operations in data.table. The standard documentation in data.table is excellent, but here data.table is applied on a real world dataset: 337 K flights from NYC.