
chengjiun
Cheng-Jiun Ma
Recently Published

Analysis and Presenting Stock Time Series Data with quantmod
For Course project of Data Analysis class (Developing Data Products)
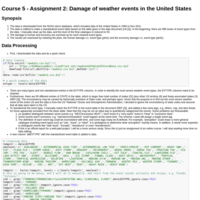
Damage of weather events in the United States
Course 5 - Assignment 2
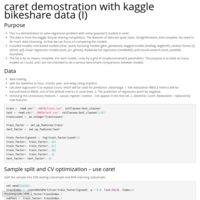
1. The data is downloaded from the NOAA storm database, which included data of the United States in 1950 to Nov 2011.
2. The data is editted to make a standardized event table based on the table given in the data document (ref [2]). In the beginning, there are 985 levles of event types from the data. I manually clean up the data, and the level of the final catalogue is reduced to 55.
3. The damage to human and ecomony are summed up for each cleaned event types.
4. The results are examined by makeing the plots, the human damage v.s. event type (plot1) and the economy damage v.s. event type (plot2).