cneskey
Corey Neskey
Recently Published
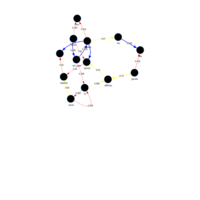
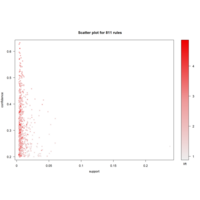
Association Rule Learning - Apriori - Market dataset
A visualization of the support, confidence, and lift of the rules output from the following apriori algorithm code/parameters:
# Apriori
library(arules)
dataset = read.csv("Market_Basket_Optimisation.csv", header = FALSE)
dataset = read.transactions("Market_Basket_Optimisation.csv", sep = ",", rm.duplicates = TRUE)
summary(dataset)
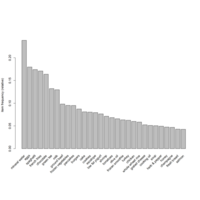
itemFrequencyPlot(dataset, topN = 30)
rules = apriori(
data = dataset,
parameter = list(
support = .004,
confidence = .2)
)
inspect(sort(rules, by = 'lift')[1:10])
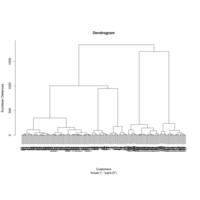
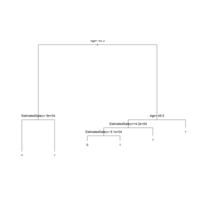
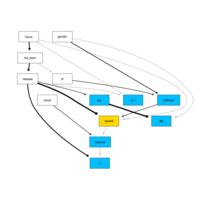
Dendrogram of Customers | Euclidean
Dendrogram of Customers by Euclidean distance to visually determine optimal number of clusters for hierarchical clustering
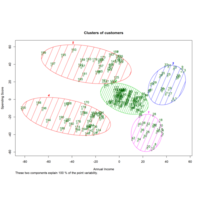
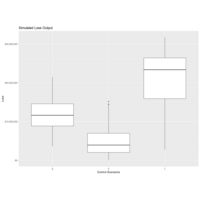
Clusters of customers by their spending and income
Cluster 1 - Careful (high income, low spenders)
Cluster 2 - Standard (average income, average spender)
Cluster 3 - Target (high income, high spender)
Cluster 4 - Sensible (low income, low spender)
Cluster 5 - Careless (low income, high spender)
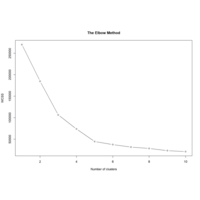
The Elbow Method
The Elbow Method for determining the optimal number of clusters to include in your K-means machine learning model of your K-means problem.