
conniez
Connie Zabarovskaya
Recently Published


rCharts and Interactive Dashboards
A short presentation on rCharts and ShinyGridster and how they can be used to build interactive dashboards as a shiny app.
Severe Weather Damage to Health and Economy
This is a submission for Reproducible Research Assignment 2

Course Project Presentation
This is a presentation for Shiny App "Flight Departure Delay Predictor for Newark Airport in NY", developed for Data Products Class on coursera.org
Data Visualization Presentation
The script for the Data Visualization Presentation at the Meetup "Interactive Visualization and Publishing Data using R (ggvis and rCharts)" on July 23rd, 2014
NVD3 Chart for UFO Reports
Demo for an NVD3 chart from rCharts package in R
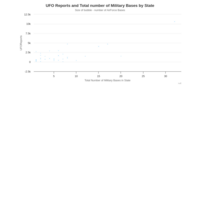
UFO Reports rChart
This shows how an rChart would look like on RPubs without an Rmarkdown document.
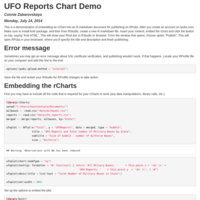
Publishing rCharts on RPubs
This document explains how to publish rCharts within an R-markdown doc on RPubs.